
Table of Contents
- The Map: Nine Layers for a Post-Mortem
- Why the Order Runs Top Down
- Part I: How the Machine Was Built
- Part II: The Business Case
- Part III: System Architecture
- Part IV: The Order Book and the Matching Engine
- Part V: Market Data and Determinism
- Part VI: Risk and Control
- Part VII: Microstructure and Execution Quality
- Part VIII: Latency
- Part IX: The Code
- Before the Next Post-Mortem
- The Printed Edition
- About the Author
A clock offset looks exactly like latency. A cross-venue latency series carries true latency plus the offset between two clocks. When a venue’s clock source fails over, the series shows a clean step, and the desk goes hunting for a network regression. No network fix will move that step.
A team needs a check that separates the clock from the network before anyone starts on a fix.
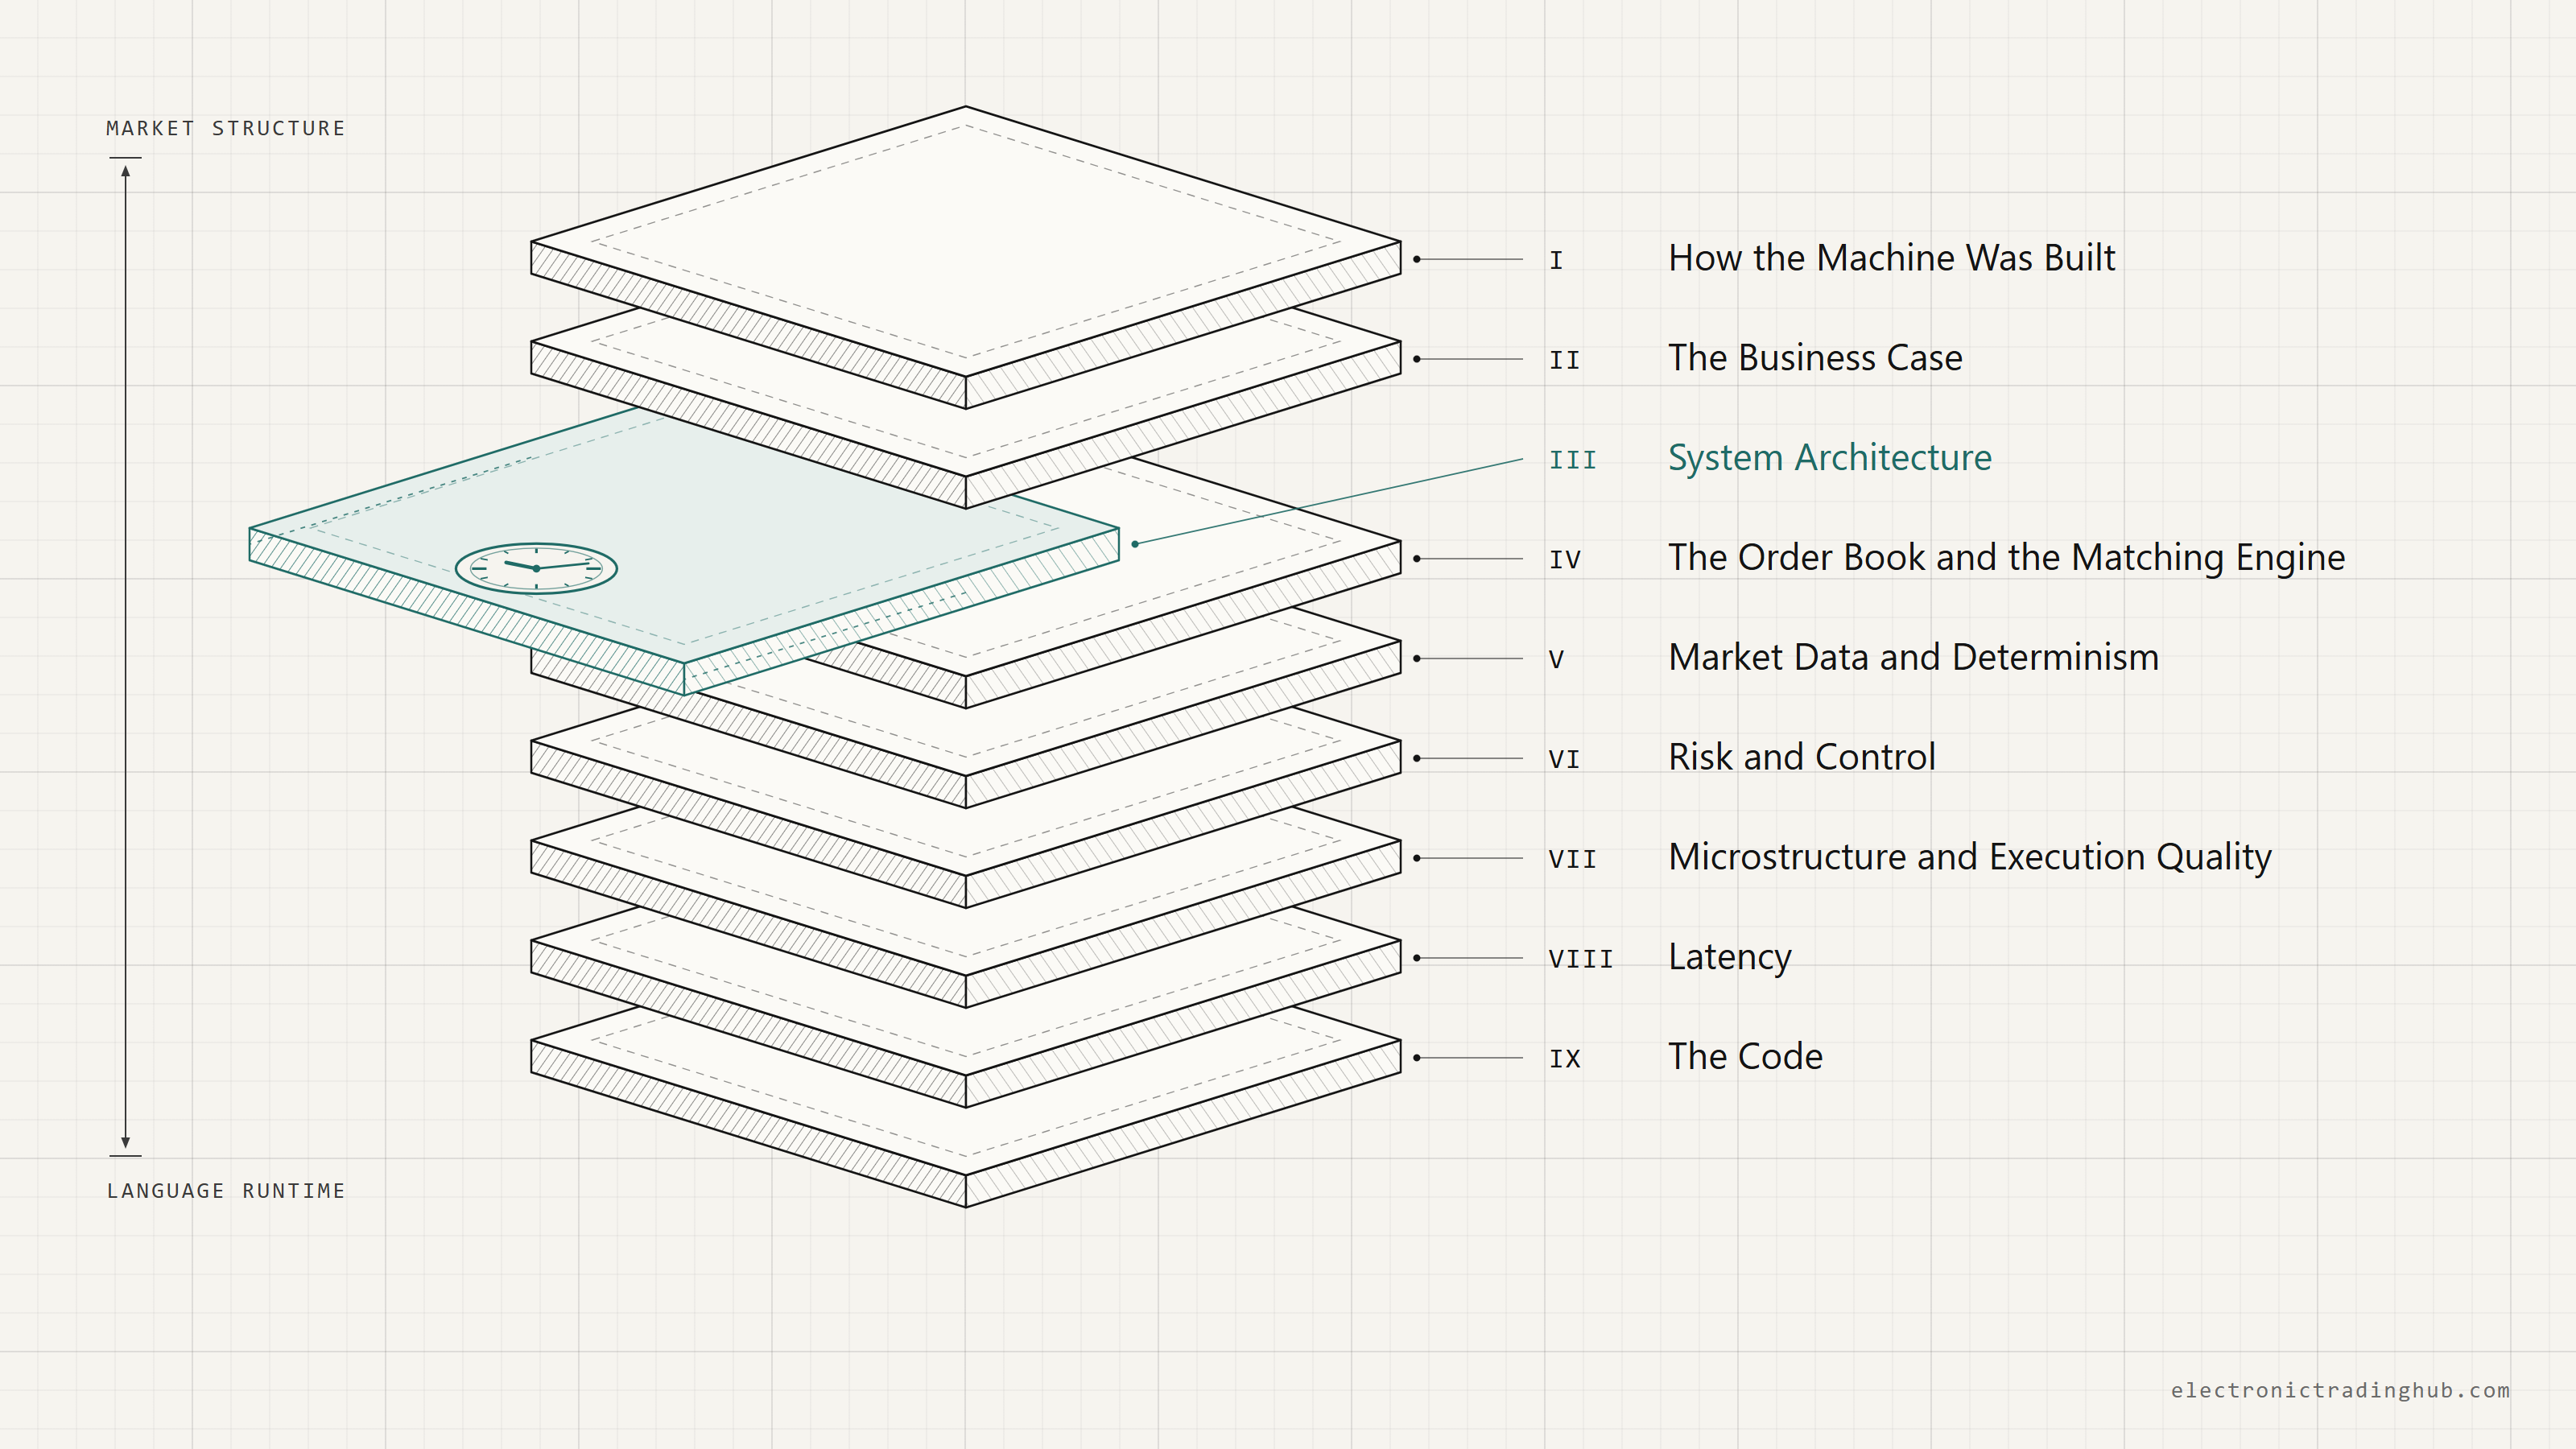
This article maps nine cases like that one, one for each layer of an electronic trading system, from market structure at the top to the language runtime at the bottom. Each section gives what the layer decides, how its failure looks from outside, a finding from the chapter that covers it, and a check your team can run. The full map is a table you can copy, and it comes first.
The nine layers are the nine parts of my book, The Electronic Trading Stack. I have spent more than twenty years building matching engines, feed handlers, order management systems and risk gates, and the book collects 54 articles I published on this blog between 2021 and 2026. They stay free online, and every chapter named below links to its free article.
The Map: Nine Layers for a Post-Mortem
| Layer | What it decides | The failure reads as | The cause, in the chapter’s case | The check that separates them |
|---|---|---|---|---|
| I. How the Machine Was Built | Which market the system is built for: venues, rules, hours | A slow on-call response at 3 AM | An uptime target set for a market that closes | Time from losing the primary venue to orders on the secondary, with no human step |
| II. The Business Case | What the desk spends before it trades, and in what order | The order management system (OMS) quote is the cost problem | Fee tiers split across venues | Each venue’s 30-day volume against its next tier line |
| III. System Architecture | The components, their boundaries, and whose clock stamps each number | A network regression | A clock offset inside the latency figure | Per-venue clock offset against one reference clock, every figure tagged by timestamp source |
| IV. The Order Book and the Matching Engine | The book’s data structures, and the order in which events reach them | A signal that flips with no code change | A replay sorted on wall clock in place of the counter | Replay both orderings, hash checkpoints, bisect a mismatch that does not heal, walk events for sign-based signals |
| V. Market Data and Determinism | What the system knows about a venue, and how much it may send back | Not enough capacity, so buy another session or cabinet | A threshold read in the wrong unit | Conservative reading first, walk the cadence up under controlled conditions to the first reject, hold the measured value |
| VI. Risk and Control | When the desk stops quoting, and what it may still hold | A control that worked, because the breaker fired | Exposure the breaker never governed | Breaker firings and priced dark minutes, next to what the position-size governor would have allowed |
| VII. Microstructure and Execution Quality | How a fill gets measured, and what the model is told about the book | A model that stopped working | A feature that cannot say it is stale | Does each value carry a staleness flag, and does a calibration need a minimum event count? |
| VIII. Latency | What counts as meeting the latency bar | A healthy middle of the distribution | A tail the acceptance report does not read | Boundary, load and percentile stated, full distribution re-run under burst load after every change |
| IX. The Code | Which language, compiler and runtime settings run the hot path | The language | One loop and one runtime default | Before any language comparison: same binary, runtime setting explicit, repeated process starts, hot loop on and off |
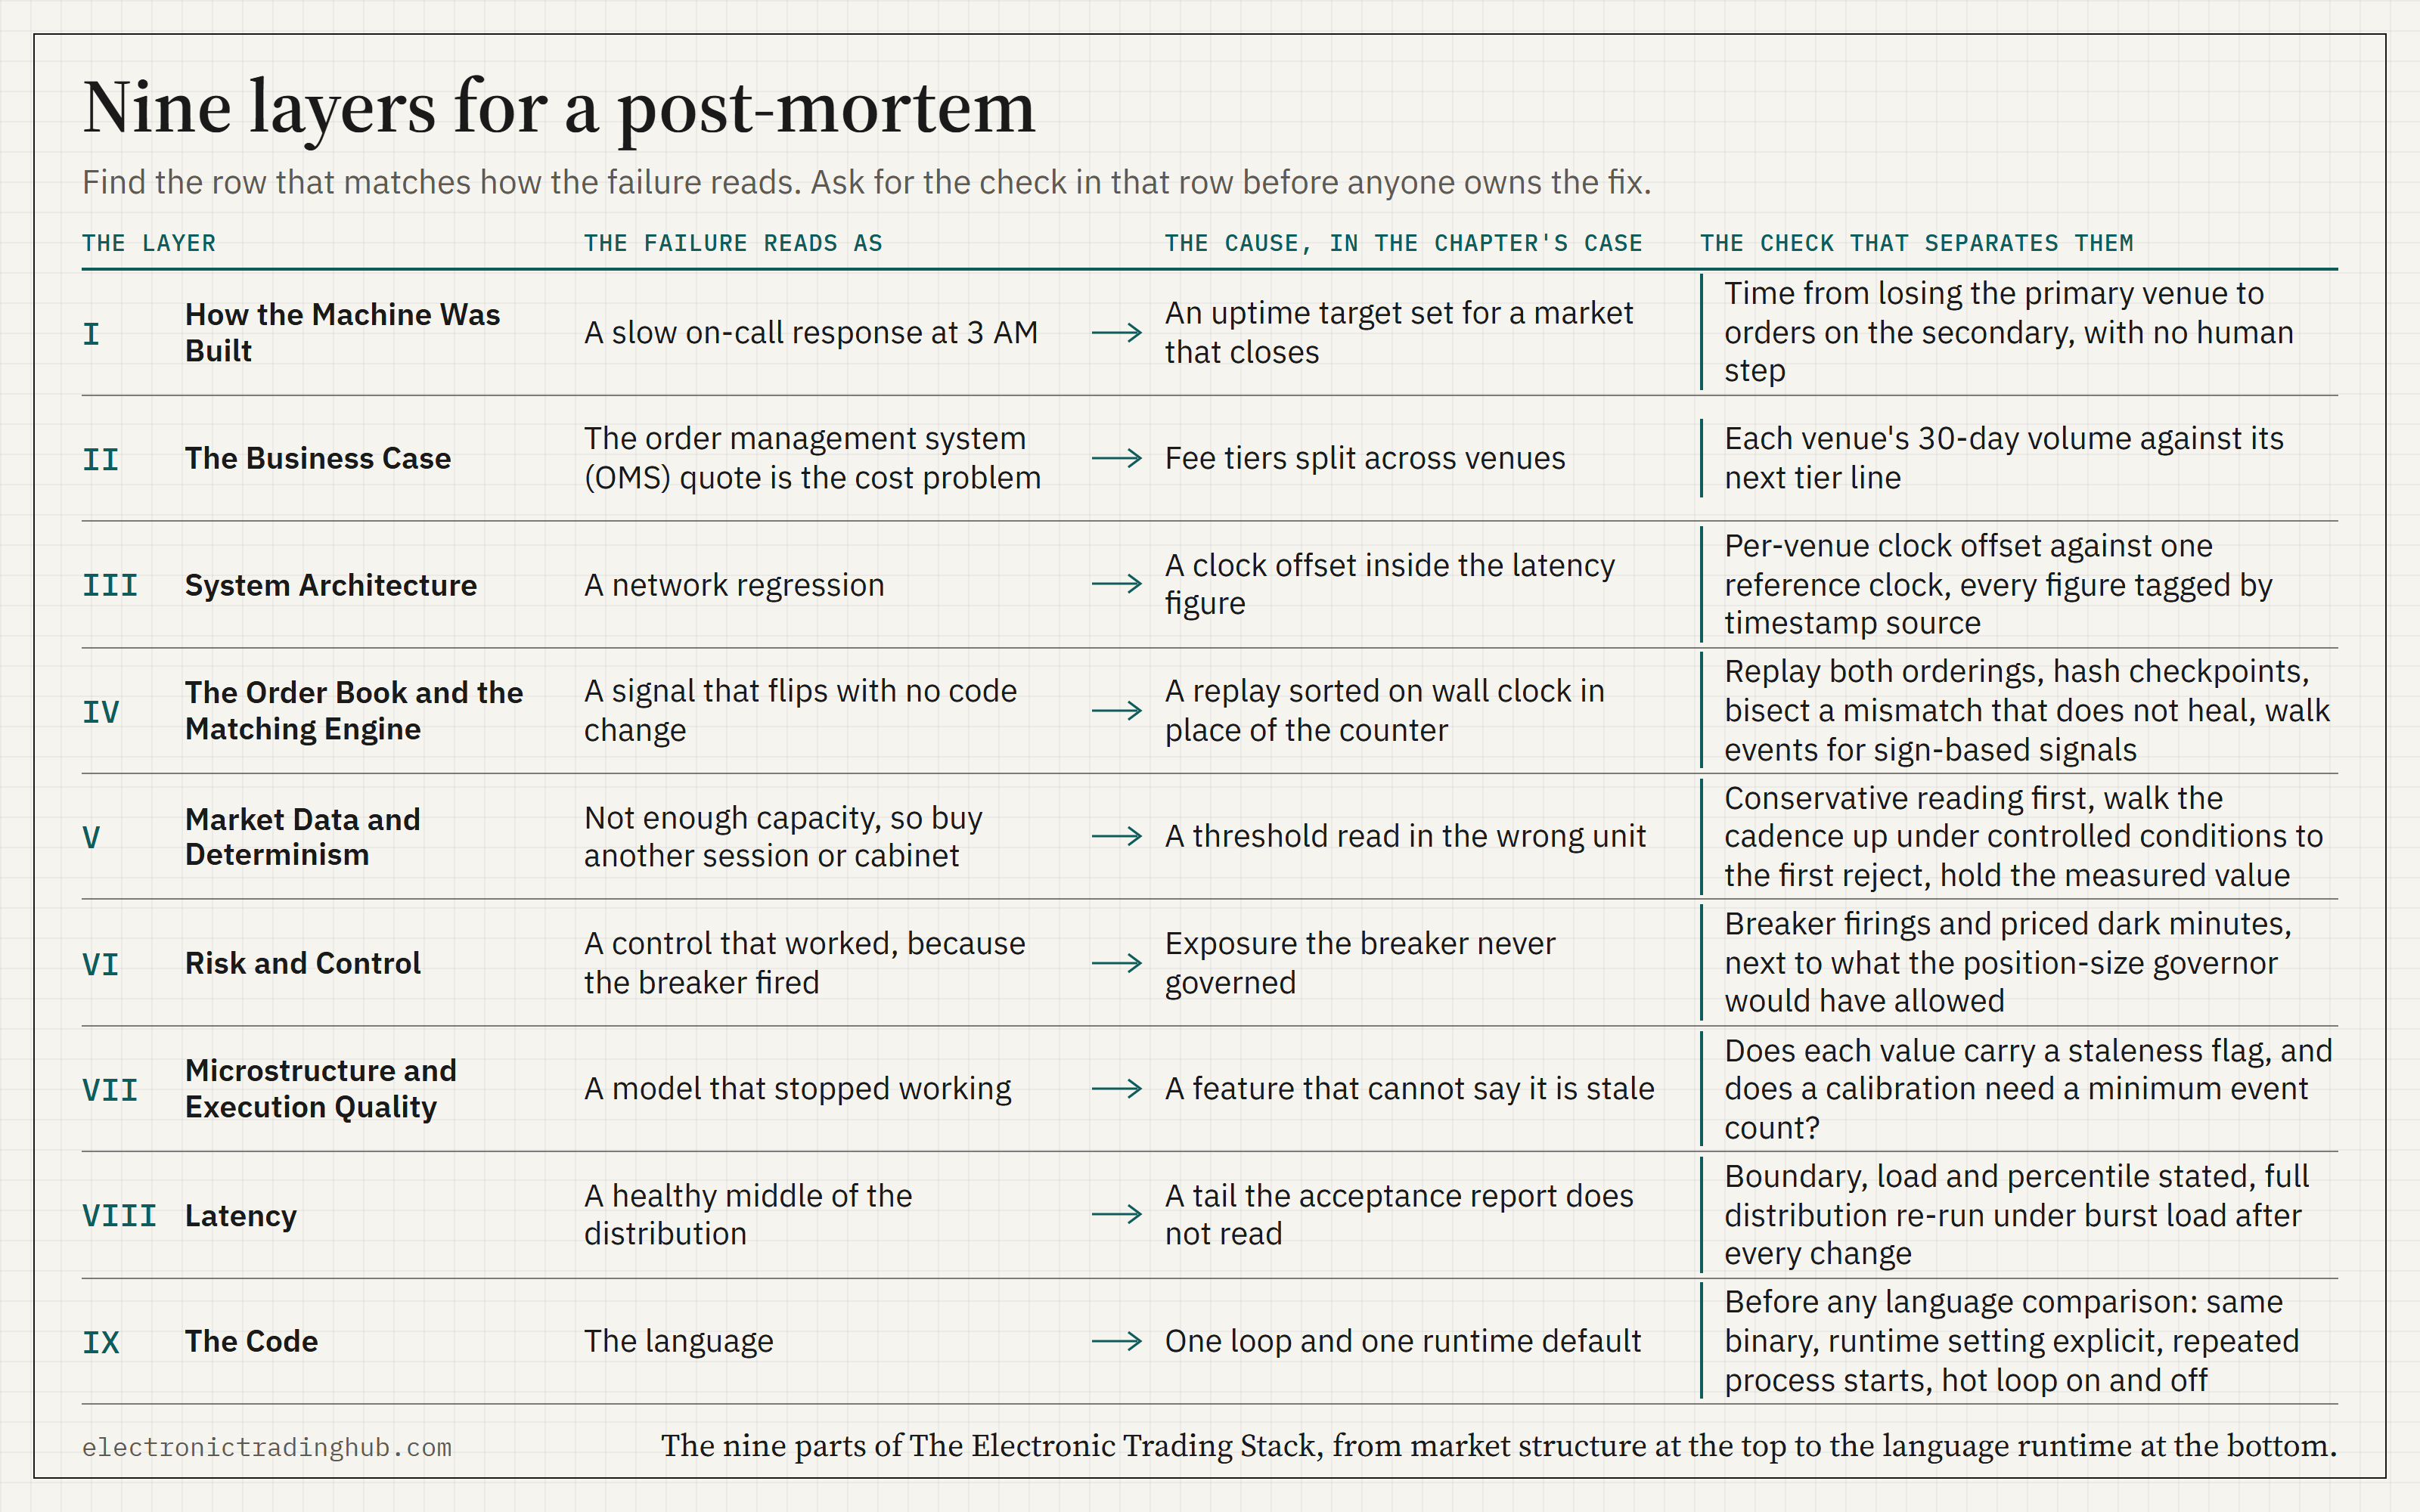
The table works as a shared reference for a team, so copy it into your post-mortem template. Each row holds one case from one chapter, so the cause column is the first place to look, and your case may differ. In a post-mortem, find the row that matches how the failure reads. Ask for the check in that row before anyone owns the fix.
Why the Order Runs Top Down
Thank you for reading this post, don't forget to subscribe!
I ordered the chapters by altitude, with the high-level material first and the metal last. Each chapter sits in the part its argument belongs to, whichever venue it uses as an example.
Two placements show the rule. The chapter on a circuit breaker for a book with no best bid and offer (BBO) takes a foreign exchange (FX) desk as its example. It sits in Risk and Control, under the title The Empty-BBO Problem: Designing an FX Circuit Breaker. Five Stack Layers That Decide Fill Quality on a Nanosecond Venue was first published under a title that named one exchange. It sits in Latency.
Part I: How the Machine Was Built
A 99.5% uptime target allows 43.8 hours of downtime a year, which is 0.5% of 8,760 hours. That was an acceptable target when markets closed. At 99.95% the allowance is 4.38 hours, a tenth as much. A system sized for the first number and run in a market that never closes carries ten times the downtime the second number allows.
Part I asks which market the system is built for: its venues, its rules, and whether it ever closes. The chapter rests on one sentence: “The system either knows what to do without human intervention, or it waits for an operator who might not be available for 20 minutes.” The slow response at 3 AM comes from that design, and the design comes from an uptime target written for a market that closes.
The chapter’s first question is the check, and it comes from Why Traditional Infrastructure Fails at 3 AM. If your primary execution venue becomes unavailable at 3 AM on Sunday, how long until orders route to secondary venues? If the answer is “when the on-call engineer acknowledges the alert,” the chapter calls the architecture operator-dependent.
Part II: The Business Case
Binance’s spot schedule charges a Regular User 0.100% as both maker and taker below $1M in 30-day volume. The taker rate falls to 0.060% at VIP 3, which needs $20M in 30-day volume and 100 BNB, Binance’s own token. The gap is 0.040%, or 4 basis points. On $50M a month of flow that all takes liquidity, 4 basis points is $20,000 a month. That figure is an estimate on structure. It assumes all-taker flow on the spot schedule before any BNB discount, with the volume consolidated where that tier applies, and it measures no desk.
The business case covers what the desk spends before it trades, and in what order. Every venue computes its tier on its own volume. Split the $50M evenly over four venues and each sees $12.5M, under Binance’s $20M line. At that volume a desk on Binance’s schedule can reach VIP 2, which needs $5M and 25 BNB, and the taker rate at VIP 2 is still 0.100%.
The budget debate circles the OMS quote, and the chapter calls that the wrong frame. Fee-tier fragmentation is one of three gaps the chapter says the cost stack does not make visible, along with reconciliation lag and the execution quality gap.
To check it, list each venue’s 30-day volume next to that venue’s next tier line and price the difference. The chapter is written for a fund with $50M in assets under management (AUM): The Cost Stack at $50M AUM, Before the First OMS Contract.
Part III: System Architecture
System architecture sets the components, the boundaries between them, and whose clock stamps each number.
The chapter’s example is a transaction cost analysis (TCA) pipeline that reads time of fill from the exchange timestamp on venue A and from the receipt timestamp on venue B. That series carries true latency plus the clock offset between A and B. The venue-side events that move it are a Network Time Protocol (NTP) resync, a leap-second handling difference, or a clock-source failover. The signature is a clean step or slow drift that does not correlate with any change on your own infrastructure, and it follows one venue’s clock. With a step at venue C, A against B looks fine and A against C shows the jump.
The check is to measure each venue’s clock offset against a single reference clock, sample it continuously, tag every latency and TCA figure with the timestamp source it came from, and alarm on any step larger than your normal one-way jitter on that path. The chapter covers this as time discipline, the second of its four layers: The Four Layers Beneath Smart Order Routing.
Part IV: The Order Book and the Matching Engine
I built a harness to measure what a wall-clock sort does to a replayed order book. It generates 400,000 events across two feeds, with host B’s clock running a fixed 50.0 microseconds ahead of host A’s. It replays the events twice through the same book code, once in the order of the gateway’s counter, which records the order the gateway processed each event in, and once in the order of the wall-clock timestamps. After every 1,000 events it hashes the full book state from each replay and compares the two.
The data is synthetic, so every rate below follows from how I generated it. No rate below describes a real market.
Sorting by wall clock reorders 2,019 events relative to the gateway’s order, half a percent of the stream. The first checkpoint mismatch that does not heal comes at event 244,000. A per-event walk finds something the checkpoints miss: the sign of the order book imbalance differs between the two replays on 85 events. The first is event 3,761, which sits between matching checkpoints at 3,000 and 4,000, so the checkpoint gate reports two clean matches around it.
Those 85 events are 0.02% of the stream, and every one of them lasts exactly one event, so a signal computed on any window wider than a single event never observes them. That is the result at a 50 microsecond offset. At 100 microseconds the same generator produces 32,822 events with a different sign, 8.2% of the stream, in episodes running up to 13 events. In the chapter’s words, a signal your desk trades on can flip sign with no code change at all.
Part IV covers the book’s data structures and the order in which events reach them. This finding is about the order. Run both orderings, hash the book at checkpoints, and bisect any mismatch that does not heal by the next checkpoint. For a signal that reads the sign, walk the two replays event by event as well, because the checkpoints miss it. Sequencer Determinism: Wall Clock Versus Monotonic Counter has the full run.
Part V: Market Data and Determinism
Market data and venue limits set what the system knows about a venue and how much it may send back.
CME’s Messaging Controls page opens by saying it measures Transactions per Second, enforced at the iLink session level. It then describes a count: messages sent over a pre-defined interval, with the count and the interval resetting if no violation has occurred. For New Order and Cancel/Replace it prints a reject threshold of 500 and a terminate threshold of 750, with no unit, under an interval column that reads “Three-second window.” The recovery rule for those thresholds is a rate: messages are rejected “until the messages per second (MPS) rate falls below the threshold.” Mass quote thresholds are stated as a rate too, “messages per second (MPS) over a three-second window.”
That is my reading of a page that uses both units, and CME may intend one of them. Read 500 as a count and the session sustains roughly 167 messages per second. Read it as a rate and the session sustains 500, which is 1,500 messages across the three-second window. The two readings differ by a factor of three.
A generous reading that turns out wrong produces rejects under no metric your dashboard watches. A conservative reading that turns out wrong means you quote at a third of what you pay for, then conclude you need another session or another cabinet to buy back capacity you already own.
The check is to adopt the conservative reading as the default, walk the cadence up under controlled conditions until the first reject, and hold the measured value as session state. Certification will not settle it. Production keeps cancel requests in a separate bucket, at 1,000 reject and 1,500 terminate. CME’s New Release environment merges the two buckets into one at 20 reject and 70 terminate, so “a cadence that passes certification tells you very little about production.” The same layer covers what you store for replay. Capture only derived snapshots and “you cannot tell whether a discrepancy is a market event or a bug in your own book-building logic.” Both questions have full chapters: Venue Message Rate Limits and the Multi-Venue Quoting Engine and Designing Market Data for Deterministic Replay.
Part VI: Risk and Control
Years ago, at a sell-side FX desk, we pulled our own prices off EBS and LSEG, on purpose, in the middle of a live session. The trigger was mechanical: fewer than two liquidity providers (LPs) quoting a given pair. Below that line, our contributed price would have been one dealer’s book, echoed through our pricing gateway under our own name.
Risk and control decide when the desk stops quoting and what it may still hold. The chapter’s boundary case comes from public record. On 15 January 2015 the Swiss National Bank discontinued its minimum exchange rate and cut its interest rate to negative 0.75%. In a case like that a breaker can fire exactly as designed and still leave the desk exposed, because the breaker says nothing about the position book that existed one second before the trigger. A circuit breaker governs what you quote going forward. It does not govern what you already own. Kraken’s trading rules state that the exchange “does not employ the use of automated circuit breakers to halt trading in markets available on the platform,” so on a venue like that the automated trigger has to live in your own stack.
The chapter also records what I cannot answer. The dark minutes are the time our prices were pulled: “I cannot tell you how often it fired, or what the dark minutes cost across two years of running it. We never built that instrumentation.”
The check is the test I would run today, on any desk. Count how many times your breaker fired in the last year. Price the dark minutes at your average spread times average notional during those windows. Put that figure next to what your position-size governor would have allowed the book to carry during a two-standard-deviation move in the same period. If nobody in the risk review can produce both numbers on request, the review has been scoped too narrowly. The Empty-BBO Problem: Designing an FX Circuit Breaker has the full design.
Part VII: Microstructure and Execution Quality
At fifty trades an hour, a sixty-second window holds 0.83 events on average. A calibration that accepts a window like that produces a parameter dominated by noise.
The feature the model reads has a second problem. An order flow imbalance (OFI) of zero on a liquid book means balanced pressure. An OFI of zero on a book that last printed eight minutes ago means you have no information about current pressure. A model that receives only the zero cannot tell the two apart.
Execution quality depends on how a fill gets measured and on what the model is told about the book. When a market-making model abandons a thin book, the chapter puts it this way: “The cause is almost always the feature layer feeding the model.” The check has two questions. Does every value carry a staleness flag, with the time of the last event that contributed to it? Does a calibration need a minimum event count before it is trusted? Illiquid Market Making: The Feature Pipeline Decides builds the case on a thin book.
Part VIII: Latency
Databento’s published breakdown of the OPRA options data feed gives a case where the middle of the distribution hides the change. OPRA completed its move from 48 lines to 96 lines on February 5, 2024. Databento reports that 99th percentile (P99) latency fell from 543.5 microseconds to 57.5 microseconds, a drop of about 89%. It also reports that the median has stayed mostly unchanged around 19.5 to 20.5 microseconds since OPRA’s move to the Pillar platform in 2021. Those are Databento’s figures from a single vendor page, and I have not measured them myself.
An acceptance report built on the middle of the distribution would have scored that upgrade as close to nothing happened, while the P99 moved by a factor of about 9.5 (543.5 divided by 57.5). The same report, run before the upgrade, would have shown a median around 20 microseconds while the P99 sat at 543.5.
The acceptance report decides what counts as meeting the latency bar. State three things beside every latency figure: the boundary where the clock started, the load it was captured under, and the percentile. Then re-run the full-distribution capture under worst-burst load after every change. What and How to Measure Trading System Latency sets out the full acceptance bar.
Years ago, I met with a team of 8 engineers at a small proprietary trading firm, high frequency. Before starting any refactor, I sat with their CTO and we built the benchmark. We measured the old systems and subsystems first, on the code they already had, so that afterwards we could say what a change had done. Then it became a loop: measure, improve, measure again. We reached under 100 microseconds back then, software only, and stopped there, because for what they were doing it was enough.
Part IX: The Code
The last part covers the language, the compiler and the runtime settings that run the hot path. Two of its chapters come from one public benchmark, the repository hft-dotnet-vs-cpp on GitHub, with results pinned at commits 1084972 and 19e7c66. The workloads are a Financial Information eXchange (FIX) message decoder and an order book, each written in C++ and C#. The decoder figures below are from Windows x64 with .NET 10, on one laptop, apart from one Linux figure marked as such.
With checksum validation on, C++ leads by 33.13 nanoseconds per message (ns/msg): 85.16 against 118.29, using the MSVC C++ compiler, version 14.44, with C# tiering off and no profile data. With validation off, the lead drops to 4.08 ns/msg. The byte-sum loop inside the checksum accounts for 88% of the gap against version 14.44 and 80% against version 14.51. About ten lines of hand-written vector code move C# from 118.29 to 91.63 ns/msg.
The second chapter measures a runtime default. The same binary, on stock settings, decoded at 964.13 ns/msg. With the QuickJitForLoops setting off it decoded at 124.85, a ratio of 7.72. Across two matrix runs the slow result appeared on 17 of 22 process starts. The runtime’s just-in-time (JIT) compiler starts methods that contain loops in unoptimized tier-0 code. Microsoft’s documentation says that if you omit the setting, quick JIT is not used for methods that contain loops. The runtime source sets the default to 1, which is on, where on-stack replacement is compiled in. The documentation and the source give opposite defaults.
All of this ran on one laptop. I measured no tail latency and no garbage-collection pause distribution. The repository’s Linux runs, inside WSL2 on that laptop and never pooled with Windows, show no cliff: 137.76 ns/msg on stock settings. On the order book, C++ wins decisively on Linux. On Windows, in the summary pinned at commit 1084972, it beats idiomatic C# by 11 to 13%, and tuned C# is statistically indistinguishable. On the decoder as anyone would actually write it, C++ holds a reproducible third.
The first chapter puts the two side by side: “A 7.72x tiering penalty on most process starts dwarfs every language difference in this chapter.” The check therefore comes before any comparison. Fix the configuration first: run the same binary with the runtime setting explicit, over repeated process starts. Then switch off checksum validation and its hot loop, and see how much of the gap goes with it. Both articles are free: I Was Asked to Rebuild an HFT System in C#. I Measured It Twice. and The .NET Tier-0 JIT Cliff.
Before the Next Post-Mortem
Take the last incident your team blamed on the network, the model or the language. Find the row in the map that matches how it looked from outside, and run that row’s check. If the check finds a different cause, the post-mortem named the wrong one.
The Printed Edition
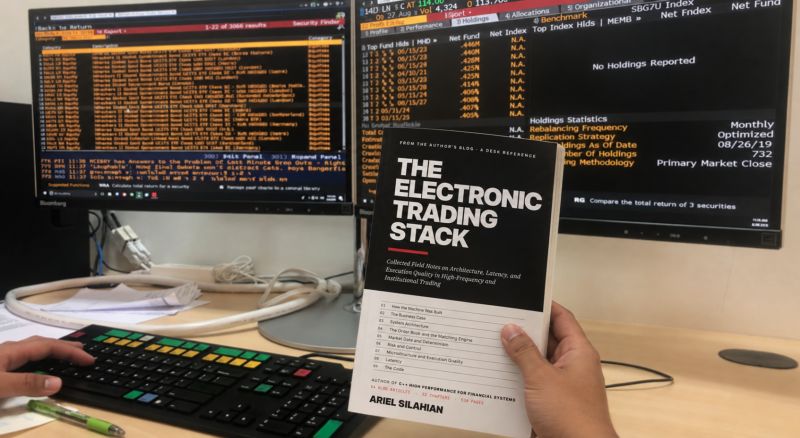
My copy stays next to my desktop for reference. People asked me for a printed edition, so I made one. It adds a reading order, from the top of the stack down to the code, and an index. If you have read the blog, you have read this material. The post announcing the book covers what the print edition holds and where to find it. Every chapter above links to its free article, and the map works without the book.
About the Author
Ariel Silahian has spent more than twenty years building matching engines, feed handlers, order management systems and risk gates for trading firms and exchanges across traditional finance, institutional FX and crypto. He is the author of C++ High Performance for Financial Systems.
Never Miss an Update
Get notified when we publish new analysis on HFT, market microstructure, and electronic trading infrastructure. No spam.
Subscribe by EmailAriel Silahian is a senior technology executive in institutional electronic trading, with 30+ years across the buy and sell side (New York, Miami, London, Hong Kong). He is the author of "C++ High Performance for Financial Systems" (Packt) and the creator of VisualHFT, the open-source microstructure analytics stack. He writes on exchange architecture, market microstructure, and execution quality, and advises a select number of trading firms on infrastructure decisions that move P&L. Book a strategy call at hftAdvisory.com