
Table of Contents
- Why Your Latency Number Is a Hope, Not a Measurement
- What to Measure: Four Acceptance Criteria for Trading System Latency
- How to Verify It: Four Measurement Mechanics
- The OPRA Proof: What a Real Tail Fix Looks Like
- Regulatory Precedent: What MiFID II and the SEC’s Rule 605 Rewrite Reveal
- When the Tail Breaks in Public
- Is P99 Obsession Overkill? The Honest Objection
- The Five-Minute Acceptance Check
- Conclusion
Why Your Latency Number Is a Hope, Not a Measurement
Ask a CTO for the latency number on their trading system and the answer comes fast. Ask what boundary it was measured at, what load condition it was captured under, and what percentile it represents, and the answer usually slows down considerably. That gap, between the number in the deck and the number that would survive an audit, is what this piece is about.
Most desks cannot prove their trading system meets its stated latency requirement. Not because the engineering is weak. Because the latency measurement discipline behind the number is thin. An average latency figure, collected on a representative trading day, at whatever point in the stack was convenient to instrument, tells you almost nothing about how the system behaves during the ten seconds that actually decided the day’s P&L.
I have spent more than twenty years building and advising on low latency trading infrastructure across venue classes, from listed equities and options to crypto-native market making, and the pattern repeats everywhere: the system that fails is rarely the one with a bad average. It is the one whose tail nobody measured honestly. On desks my team has profiled, that blind spot runs low single-digit basis points on burst days, real cost that never shows up in a monthly latency report because the monthly latency report was never looking in the right place.
This piece lays out what to measure (four acceptance criteria) and how to verify it (four measurement mechanics), grounded in a public case study from the options market data industry, and closes with a five-minute check you can run against your last latency report today.
What to Measure: Four Acceptance Criteria for Trading System Latency
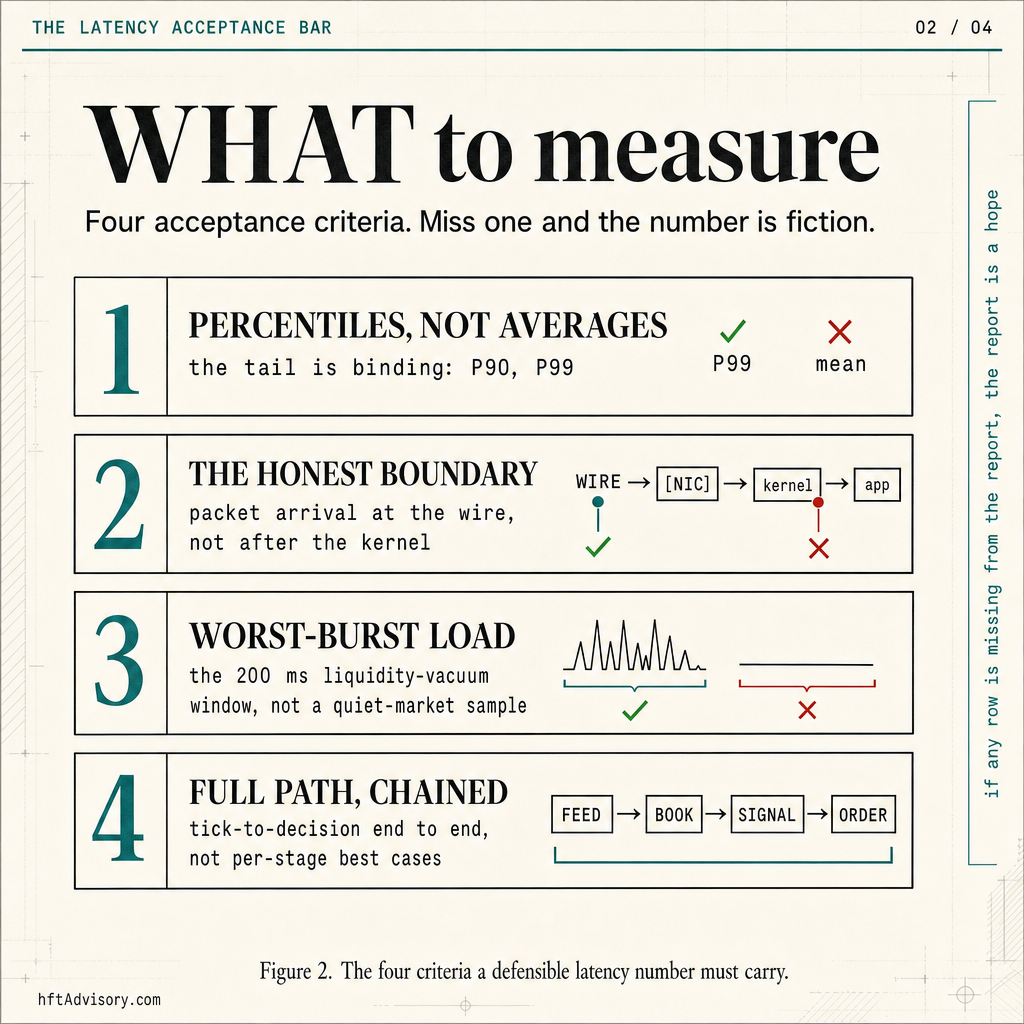
A latency number missing any of these four attributes is a hope wearing a decimal point, not a measurement.
1. Percentiles, Not Averages: The Tail Is Binding
Thank you for reading this post, don't forget to subscribe!
Average latency is dominated by the quiet majority of ticks, the ones that were never going to cost you anything. The P90 and the P99 latency are dominated by the minority of ticks that decide whether your fill was good or your risk check arrived on time. In a low latency trading system, the average is close to decorative. The tail is where the economics live.
This is not a controversial standard outside trading, either. The CTA Plan, the consolidator that publishes the realized-latency data behind the U.S. equity SIP tape (a separate feed from the OPRA options tape discussed later in this piece), publishes its own percentile charts at the 10th percentile, the median, and the 99.9th, backed by a companion dataset spanning seven percentiles out to the 99.99th, by feed and participant. The public tape reports a fuller percentile spread than most internal desk latency reports do. If the consolidator moving the entire market is willing to publish that detail, an internal report that stops at “average: X microseconds” has no excuse.
2. The Honest Boundary: Wire Arrival, Not Post-Kernel
Where the clock starts changes the number by an order of magnitude, and it is the easiest place for a latency report to flatter itself. Timestamp at packet arrival on the wire, captured via hardware timestamps off the critical path, and you get a number that includes NIC queueing, scheduling jitter, and everything else standing between the market and your decision logic. Timestamp after the kernel has already handed you the packet, and you have quietly deleted the part of the pipeline most likely to spike under load.
A latency number with no stated boundary is unfalsifiable, not merely wrong, because nobody can check it.
3. Worst-Burst Load: The Liquidity-Vacuum Window, Not a Quiet Sample
Sample your system on a quiet afternoon and the tail looks fine, because the tail only shows up under load. In the profiling my team has done across desks, the relevant load condition is a liquidity-vacuum window, a burst that runs roughly 200 milliseconds, where quoted depth evaporates and order flow spikes at the same time. Miss that window in your sampling and your P99 latency is a fiction built from a market condition that was never stressing anything.
Worth being precise here, because the terms get conflated. In feed-capacity engineering, “microburst” usually means a message-rate spike measured in milliseconds at the wire. Databento’s own published data on the OPRA options feed puts peak microbursts north of 40 million messages per second, a feed-ingestion problem: can your capture layer keep pace. The book-level liquidity vacuum described above runs on a different clock, closer to 200 milliseconds, and it is a decision-quality problem: can your strategy logic still see a real book once depth has thinned and flow has spiked. They are different animals on different timescales. Monitoring tuned to catch one will walk right past the other.
The same physics shows up differently on crypto venues, where the vacuum tends to arrive as a liquidation cascade across perp and spot books. And on a venue you do not own the rack for, the wire is not yours to instrument: the honest boundary moves to first-touch at your own ingress edge, the first timestamp you control, with the same three attributes attached.
4. Full Path, Chained: Tick-to-Decision, Not Per-Stage Best Cases
Measuring the feed handler’s P99, the risk check’s P99, and the strategy logic’s P99 separately, then assuming the end-to-end number is roughly the sum, ignores compounding. Google’s “The Tail at Scale” research found that with a 100-server fan-out, 63 percent of requests touch at least one component running at its own 99th-percentile-slow moment. Session-level web performance work makes the same point from the other direction: only about 13 percent of users in a multi-page session experience nothing worse than the per-request P99.
Neither example is about trading, but the point transfers directly to a tick-to-decision pipeline with five or six chained stages: the number that matters is the P99 of the full chain, measured end to end, not per-stage best cases added up on a whiteboard.
How to Verify It: Four Measurement Mechanics
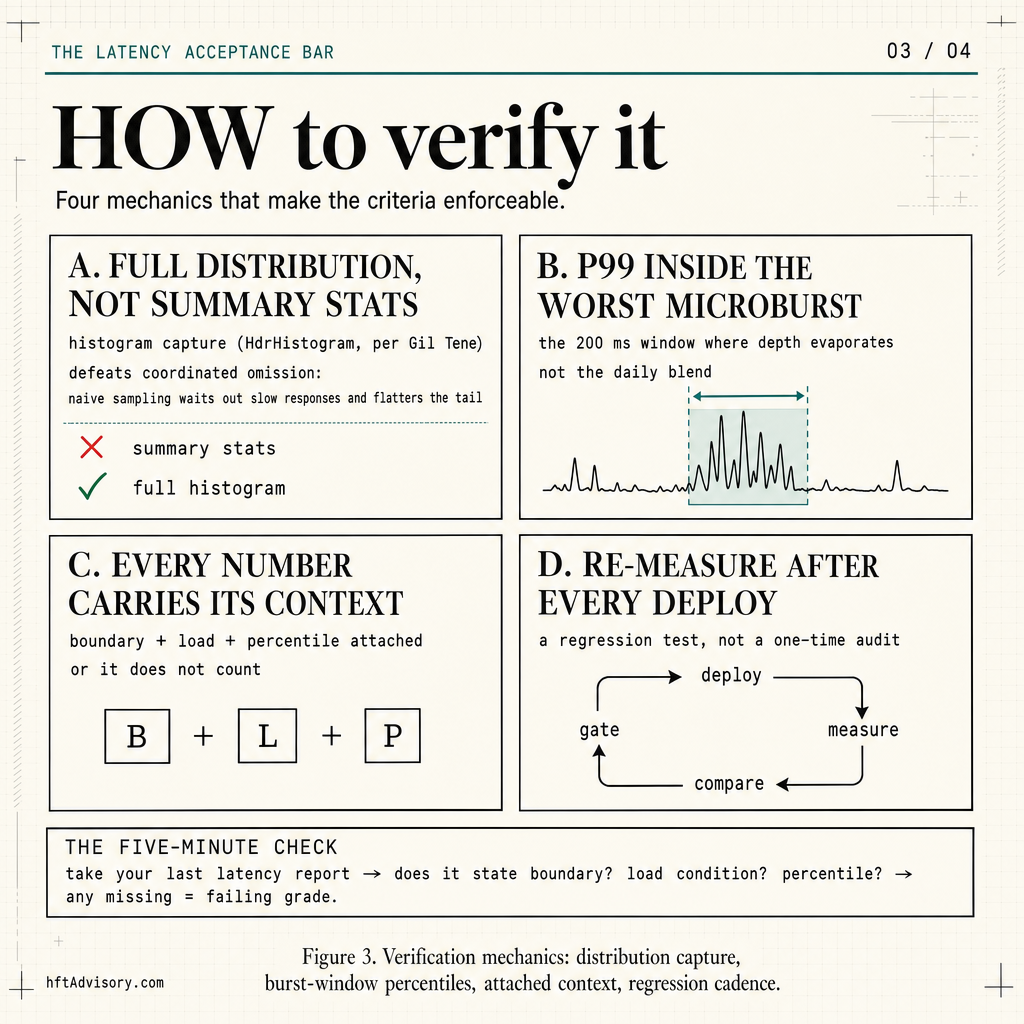
Knowing what to measure is half the discipline. Here is how the measurement itself has to be built to be trustworthy.
A. Full Distribution Capture, Not Summary Statistics
Capture the entire latency distribution, not a running average with a periodic sample layered on top. Gil Tene’s HdrHistogram is the standard tool for this precisely because naive load generators and samplers introduce what Tene calls coordinated omission: a sampler that waits out a slow response before issuing its next request systematically under-reports the tail, because it never records the requests that would have arrived during the slow period. His companion load generator, wrk2, holds a constant send rate through the slow patches, the only way to record the tail honestly rather than average it away.
B. P99 Inside the Worst Microburst Window, Not the Daily Blend
A P99 latency figure calculated over a full trading day blends the liquidity-vacuum minutes in with everything else, diluting the number that matters into a daily average with a percentile label glued on. Isolate the P99 to the worst window specifically: that number tells you what your system does when it is actually being tested, not on an ordinary afternoon.
C. Every Reported Number Carries Its Boundary, Load, and Percentile
A latency figure with no attached metadata is not verifiable, and vendors know this. AWS’s own published analysis of a crypto market-making deployment reported that cluster placement groups cut P50 round-trip latency 35 percent and P90 37 percent. Both are real numbers worth knowing, and both are conspicuously silent on P99, the percentile most likely to look worse. Reading which percentile a vendor chooses to publish tells you almost as much as the number itself. Hold internal reports to the same scrutiny: boundary, load condition, percentile, every time, or the number does not stand on its own.
D. Re-Measure After Every Deploy
A latency acceptance number is a regression test, not a certificate earned once. Every deploy, every configuration change, every firmware update on a vendor card is a candidate for silently moving the tail, and the only way to catch that is to re-run the full-distribution capture under worst-burst load after every change, not on an annual audit cycle.
The OPRA Proof: What a Real Tail Fix Looks Like
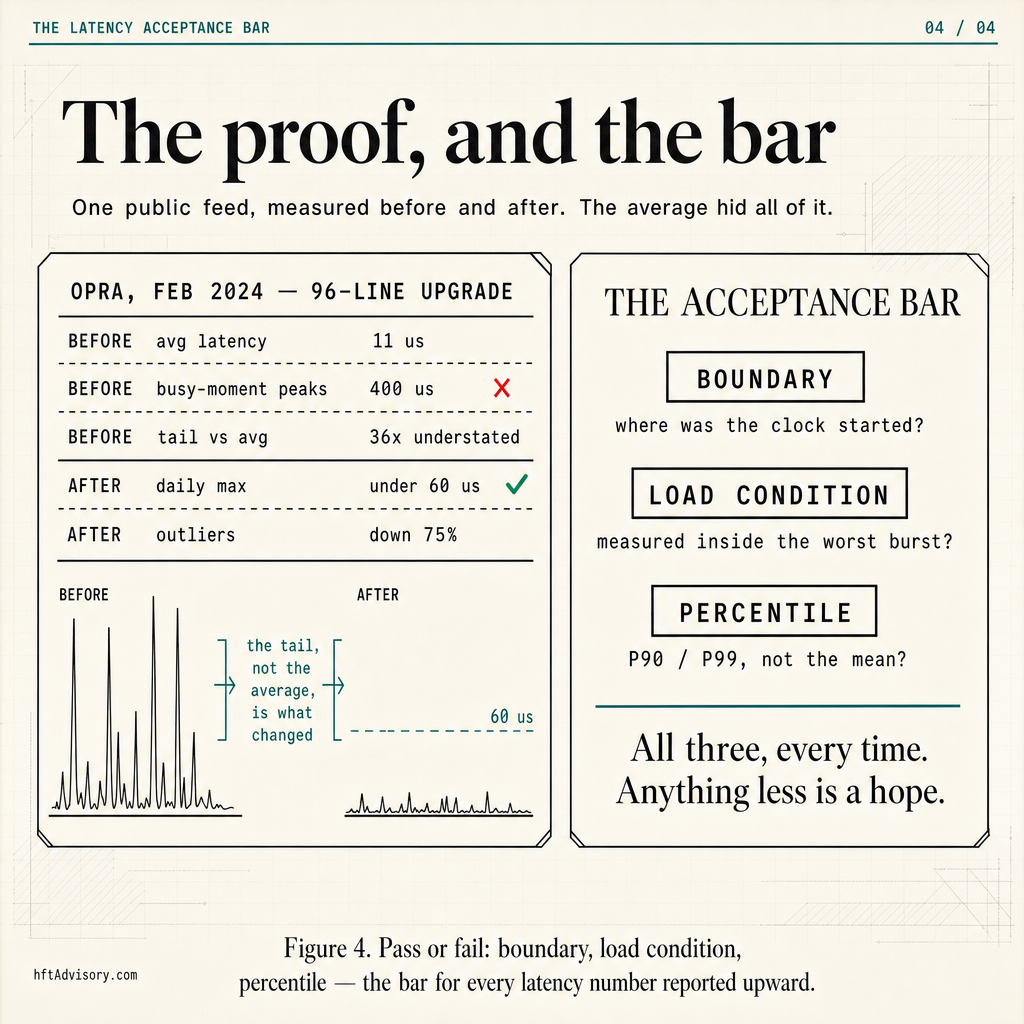
The clearest public illustration of everything above comes from the OPRA options feed: the industry’s own latency crisis and its own fix.
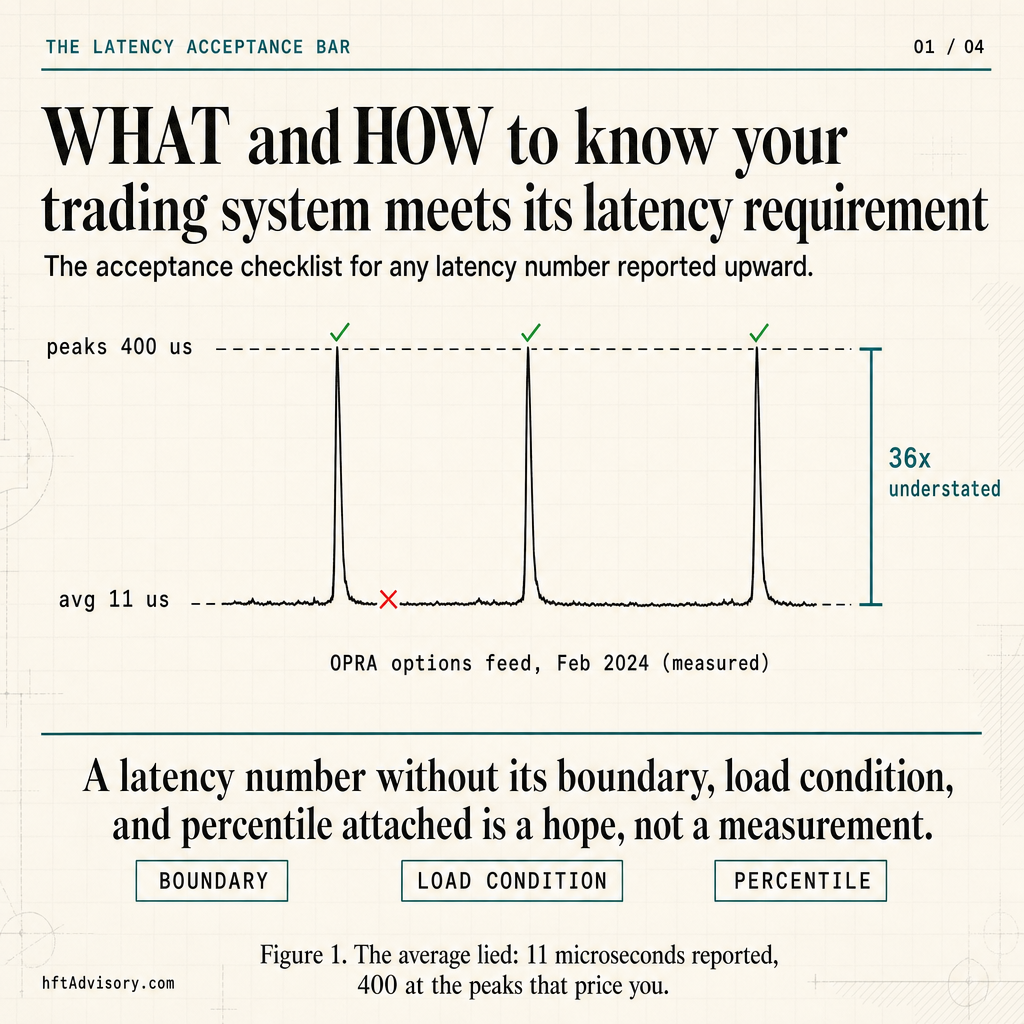
Per Pico’s infrastructure analysis, before OPRA expanded its multicast line count from 48 to 96 lines (a change that went live February 5, 2024), average publisher latency ran approximately 11 microseconds while peaks at busy moments regularly hit 400 microseconds. Do the division: 400 is roughly 36 times the average. An average-only report on the pre-upgrade feed would have shown a healthy number while the tail ran two orders of magnitude worse.
After the 96-line expansion, daily max latency reliably sat below 60 microseconds and outlier events were cut by roughly 75 percent, per the same analysis. Databento’s own published breakdown of the migration adds the sharper number: OPRA’s rated capacity rose from 400 billion to 1 trillion transactions per day, and 99th-percentile latency fell from 543.5 microseconds to 57.5 microseconds, a drop of about 89 percent. OPRA’s SIP median latency, meanwhile, has held in the 19.5 to 20.5 microsecond range since the underlying Pillar upgrade.
Read those two numbers side by side. The median barely moved. The P99 collapsed by nearly 90 percent. This was a tail fix, not an average fix, and an average-based acceptance report would have scored the entire upgrade as close to nothing happened. That is this piece’s whole argument in one public case: the number that told the truth is the one most latency reports never isolate.
Regulatory Precedent: What MiFID II and the SEC’s Rule 605 Rewrite Reveal
Two regulatory regimes have already wrestled with this exact question, and they landed in different places for instructive reasons.
Under MiFID II’s RTS 25, clock-synchronization accuracy is explicitly load-tiered. A venue with gateway-to-gateway latency above one millisecond must hold its clocks within one millisecond of UTC; at or below one millisecond, the bar tightens to 100 microseconds with microsecond-level granularity. Participants running high-frequency algorithmic trading techniques face that same 100-microsecond, one-microsecond-granularity bar regardless of the venue’s own tier. European regulation already ties its acceptance bar to the system’s own latency class; a slow venue and a fast venue are not held to the same clock standard.
The SEC took the opposite path, and its reasoning is worth reading closely. Its 2022 proposal for Rule 605 would have required share-weighted median and 99th-percentile time-to-execution reporting across all order types. The rule the SEC actually adopted, on March 6, 2024, dropped both statistics in favor of average time-to-execution plus more granular time-to-execution buckets, stating in the adopting release that it was “eliminating the proposed statistics for median and 99th percentile time to execution in favor of utilizing more granular time-to-execution buckets.” The agency’s underlying reasoning was that median and 99th-percentile figures cannot be meaningfully aggregated across the thousands of symbols and order types a market-wide report has to cover. The compliance date for the amended reporting regime, originally set for December 14, 2025, was later extended to August 1, 2026, meaning the new standard takes effect next month.
That reasoning is the hinge for the objection addressed later in this piece.
When the Tail Breaks in Public
Two recent incidents show the same failure mode at a larger scale. On June 3, 2024, a Consolidated Tape Association price-band issue triggered erroneous volatility halts on roughly 40 stocks between 9:30 and 10:27 a.m. Eastern, briefly displaying Berkshire Hathaway’s Class A shares as down 99 percent; the CTA cited a possible link to a new software release and reverted to the prior version. On November 28, 2025, a cooling failure at CME Group’s CyrusOne data center halted Globex, EBS, and BMD futures and options trading for roughly ten hours before markets reopened fully at 8:30 a.m. Eastern. Neither is a microsecond-tail story, but both share the same root gap: worst-case behavior nobody had verified in advance. The May 2010 Flash Crash is still the largest-scale version, a liquidity vacuum measured in minutes, market-wide rather than book-level.
Is P99 Obsession Overkill? The Honest Objection
There is a real objection here, and it deserves a real answer rather than a dismissal.
In most general software engineering, fixating on the extreme tail is a well-documented trap. Gil Tene makes this point himself: capture the full distribution, then read the percentile matched to your actual risk tolerance, rather than chasing the most extreme tail number for its own sake. Most consumer and enterprise software has no business defending a P99.9 SLA, and engineering time spent shaving an already-rare outlier is often engineering time misallocated.
The SEC’s own Rule 605 rewrite looks, on its surface, like institutional confirmation of that skepticism: the regulator that considered requiring P99 reporting walked it back. But look again at the SEC’s stated reasoning: percentiles were dropped because they cannot be aggregated across thousands of market centers on one standardized form. That objection does not transfer to a desk measuring its own single system. You are not aggregating your P99 latency against anyone else’s. You have exactly one tick-to-decision path, and one question: does it hold up during your worst 200 milliseconds. The SEC’s aggregation problem is not your problem.
The BIS’s own research on latency-arbitrage races in FTSE 100 stocks shows why the stakes are not hypothetical for HFT and market-making desks specifically. Races occur roughly once per minute per symbol, the modal race lasts five to ten millionths of a second, races account for around 20 percent of trading volume, and the top six firms capture more than 80 percent of the wins and losses. When the unit of competition is measured in single-digit microseconds and a fifth of the volume runs through it, an average latency number is a blind spot with your desk’s own money behind it, not a simplification.
The Five-Minute Acceptance Check
The three questions below are the fast version of this discipline, worth running before building out a full measurement platform, and the tiering that follows scales in as the desk’s book and venue footprint grow.
You do not need a new measurement platform to find out whether your last latency report would survive scrutiny. You need five minutes and this checklist.
Pull your most recent trading system latency report and check it against three questions:
- Boundary. Does the number state where the clock started? Wire arrival via hardware timestamp, off the critical path, or somewhere after the kernel already touched the packet? If the report does not say, assume the flattering answer and treat the number as unverified.
- Load condition. Was the number captured during a representative burst, specifically your liquidity-vacuum window, or during an average trading period that never stressed the system? A P99 latency figure from a quiet market is not a P99 of anything that matters.
- Percentile. Is the reported figure an average or a percentile? If it is a percentile, which one, and is it isolated to the worst window or blended across the full session?
If your last report cannot answer all three, in writing, you do not have a latency acceptance bar. You have a number someone believed. That failing grade is information, not a crisis, and it is cheaper to act on before the next burst prices it in than after.
A Starter Version of the Load-Tiered Bar
Borrow MiFID II’s structure without the regulator: classify instruments and venues into two or three tiers by observed burst intensity, then set the binding percentile, the window, and the re-measure cadence per tier instead of one blanket standard.
| Tier | Burst profile | Binding percentile | Window | Cadence |
|---|---|---|---|---|
| 1 | Worst window close to baseline | P95 | Full session | Quarterly |
| 2 | Worst window several multiples of baseline | P99 | Worst window only | Every deploy |
| 3 | Worst window is where the edge is won or lost | P99.9 or deeper | Worst window only | Every deploy, with live watch |
The multiples are read off your own distribution, not a consultant’s table; what carries over is the shape: a deeper percentile and a shorter cadence for the tiers under the most stress. What this starter version does not settle: one strategy spanning venues with different burst physics has to satisfy two tiers at once, and that is closer to an open problem than a checklist line.
Conclusion
The gap between “we measured latency” and “we can prove our system meets its latency requirement” is exactly the gap between an average and a properly bounded P99. OPRA’s own public numbers show how large that gap can get, and how invisible it stays until someone isolates the tail on purpose.
Here is a falsifiable version of the check above, if you want to run it properly rather than take the framework on faith. Capture your full latency distribution with a tool that defeats coordinated omission, isolate the P99 to your worst 200-millisecond window over the last month of trading, and compare that number, boundary and load condition attached, against the figure sitting in your latency report. If the two numbers are close, your report was already honest. If not, you now know exactly how far off it was, and where to start.
The tiering above is a start, not a finished answer. Cross-venue portability, the case where one strategy has to satisfy two tiers on two different clocks at once, is the edge I have not seen closed cleanly anywhere, including in my own audit work, and it is worth raising with whoever owns your acceptance criteria once the three-tier version is running.
This article was originally shared as a LinkedIn post.
Ariel Silahian has 20+ years of experience in electronic trading systems architecture, advising CTOs and Heads of Trading on infrastructure, latency measurement, and execution quality across electronic trading venue classes. For desks that want this acceptance bar run against their own system, the Discovery Assessment is a structured engagement built around exactly this kind of measurement gap.
Never Miss an Update
Get notified when we publish new analysis on HFT, market microstructure, and electronic trading infrastructure. No spam.
Subscribe by EmailAriel Silahian is a senior technology executive in institutional electronic trading, with 30+ years across the buy and sell side (New York, Miami, London, Hong Kong). He is the author of "C++ High Performance for Financial Systems" (Packt) and the creator of VisualHFT, the open-source microstructure analytics stack. He writes on exchange architecture, market microstructure, and execution quality, and advises a select number of trading firms on infrastructure decisions that move P&L. Book a strategy call at hftAdvisory.com