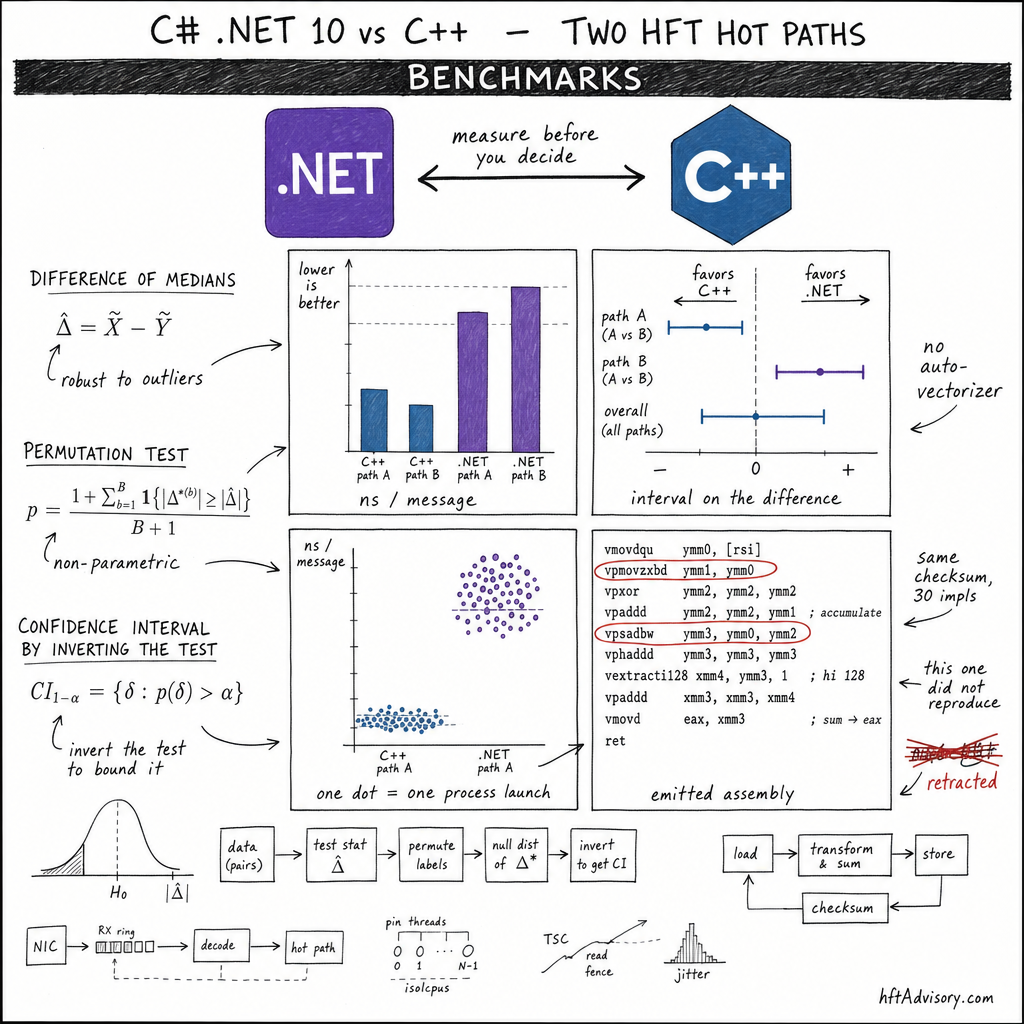

A client asked me to architect an institutional crypto trading system on .NET. Twenty years of building order books in C++ gave me an immediate answer, and it was not a polite one.
But I have one rule that outranks my instincts: measure before you decide. So instead of writing the memo I already had in my head, I built the benchmark.
Then I did the thing almost nobody does, and it is the reason this article exists. I ran the whole experiment a second time. The second run killed my own headline.
Everything below is reproducible. The harness, both implementations, all 869 raw per-launch measurement files, and the analysis scripts are public: github.com/silahian/hft-dotnet-vs-cpp.
TL;DR
- Written the way each language’s practitioner would actually write it, C++ decodes FIX 32.4% to 38.9% faster. Four cells, two operating systems, two compilers, p = 0.010 in every one, and it held across two independent runs. The most stable number in the project.
- Almost all of that is one loop. MSVC auto-vectorizes the CheckSum byte sum. RyuJIT does not, because .NET has no auto-vectorizer and the JIT team said so in 2020. Hand-write about ten lines of
Vector256and C# moves from 118.29 to 91.63 ns/msg. - What is left after that is smaller than this machine can measure. Three measurements of the same pairing gave three answers, including a sign flip between two runs of the same binaries. So this is not a tie. It is the gap ceasing to be the thing that decides your architecture.
- C++ still wins the order book on every fair configuration, by 13.2% on Windows and 48.2% to 65.0% on Linux. Branchy pointer-chasing is not where intrinsics rescue you.
- The finding worth more than the verdict: stock .NET costs 7.72x on a loop-shaped hot path, and it fired on 17 of 22 process starts. Microsoft’s live configuration doc says that knob defaults to off. The runtime source says otherwise, and the measurement agrees with the source. One line in a csproj fixes it.
- Three reflexes that bought nothing.
unsafewithfixednever won and sometimes lost outright. Suppressing the GC moved nothing, because the hot path allocates zero bytes. NativeAOT lost to the JIT by 13% to 16%.
Bottom line: closer on one of the two paths, and only if you are willing to hand-write a vector kernel. Not equal. And not close at all on the book. If you were hoping this article says “just use C#”, it does not. If you were hoping it says “C# is a toy”, it does not say that either, and one of the numbers above will cost you more than the language choice.
What this measures, and what it does not
Read this before the numbers, because it bounds every one of them.
Thank you for reading this post, don't forget to subscribe!
This measures median throughput of two microbenchmarks, on one machine. A FIX 4.4 decode and an L2 ladder update, single-threaded, pinned to one P-core, with cooldowns between launches.
It does not measure tail latency, and that matters more than anything I am about to show you. No p99, no p99.9, no GC pause distribution under allocation churn, no behavior under contention or at the open. A language that is 10% slower at the median and three times worse at p99.9 loses in production and wins in this article. The order-book fixture is also L1-resident, which I discovered by finding a 138x error in my own methodology, so nothing here describes a multi-symbol book that actually blows cache.
So this settles a narrow question, and the honest framing is that the most useful thing I found is not the language verdict at all. It is a .NET configuration default that costs 7.72x on most process starts, that contradicts Microsoft’s own live documentation, and that is one line in a csproj. If you run .NET anywhere near a trading path and you read only one section, read that one. The language comparison is the story; the config default is the thing you can act on this afternoon.
Read this with the repo open
Every file link below is pinned to commit 1084972, the exact tree these numbers came from, so the line you click is the line I measured. It will not drift when I push again.
| If you want to check | Open |
|---|---|
| that both programs do the same work | Bench.Core/Trace.cs and cpp/include/trace.hpp |
| the order-book hot loop, line for line | OrderBookWorkload.cs and order_book.hpp |
| the FIX decoder and its interchangeable sum kernels | FixParseWorkload.cs and fix_parse.hpp |
| which comparisons I declared fair before the data existed | scripts/analyze.py L55-L64 |
| the statistics, in full | analyze.py, equivalence.py, between_runs.py |
| how each configuration was actually launched | scripts/run-matrix.ps1 L52-L58 |
| the raw evidence | results/, one JSON per process launch, 869 of them |
| what I got wrong, and when | HARNESS.md §7.1 and §8, plus the commit history |
I point at the specific file as each claim comes up. Nothing below asks you to take a number on trust.
Table of contents
- Why most language benchmarks are worthless
- Proving both programs do the same work
- The order book: C++ territory
- The FIX decoder: a 35% gap that never moves
- Why: .NET has no auto-vectorizer
- The run that killed my headline
- Three things that surprised me more than the verdict
- What I would actually tell the CTO
Why most language benchmarks are worthless
Almost every “language X vs language Y” post fails in one of three ways, and each failure is invisible in the published numbers.
The two programs do different work. One side allocates and the other does not. One side validates and the other skips it. One side gets a vectorized library routine and the other gets a hand-rolled loop. The benchmark then measures the difference in the programs, not the difference in the languages.
The measurement is one process, run once. Series inside a single process share a thermal and DVFS state. Their spread measures jitter, not reproducibility. I made this exact mistake early: I published a 1.4% difference off data whose same-binary run-to-run spread was 6.5%.
Nothing is falsifiable. No oracle, no counters, no raw data. You are asked to trust a table.
So before any timing was allowed to count, I built three gates.
Proving both programs do the same work
Gate 1: a checksum oracle
Every implementation folds every intermediate result into a 64-bit checksum. If any implementation disagrees by one bit, the analysis script refuses to print a single timing.
// OrderBookWorkload.cs, inside the event loop: fold the observable state, every event
h = Checksum.Mix(h, (ulong)(long)bestBid);
h = Checksum.Mix(h, (ulong)bq);
h = Checksum.Mix(h, (ulong)(long)bestAsk);
h = Checksum.Mix(h, (ulong)aq);
Open OrderBookWorkload.cs L88-L91 and the mixing function itself at Checksum.cs L16. The gate that enforces it is analyze.py L38-L56: implementations are grouped by the value they are required to produce, and a mismatch anywhere aborts before a single table is written. The comment at the top of that block is worth reading, because it records a real miss. One implementation, orderbook_l2_opt2, was being published as the C# side of a canonical pairing while sitting outside the oracle group. It passes. Nothing would have caught it if it had not.
Thirty implementations agree on the order-book checksum (0x1C1B44A5898F65EC) and thirty-seven on the FIX decoder’s (0x5D30C4CE35A0F200), across MSVC 14.44, MSVC 14.51, GCC 13.3, RyuJIT and NativeAOT, on Windows and Linux.
Gate 2: operation counters, compiled in at zero cost
The oracle proves both languages produce the same answer. It does not prove they do the same work. A cheaper path that reaches the same result passes it easily.
So both workloads are generic over a tracing policy. In C#, that is a static abstract interface member on an empty struct. This is Trace.cs L21-L45:
public interface ITrace
{
    static abstract void Count(int slot);
    static abstract void Add(int slot, long n);
}

public struct NullTrace : ITrace          // used for every timed run
{
    [MethodImpl(MethodImplOptions.AggressiveInlining)]
    public static void Count(int slot) { }
    [MethodImpl(MethodImplOptions.AggressiveInlining)]
    public static void Add(int slot, long n) { }
}

public struct CountTrace : ITrace         // used only by `verify`
{
    [MethodImpl(MethodImplOptions.AggressiveInlining)]
    public static void Count(int slot) => TraceCounters.Values[slot]++;
    [MethodImpl(MethodImplOptions.AggressiveInlining)]
    public static void Add(int slot, long n) => TraceCounters.Values[slot] += n;
}
C++ gets the identical policy as a template, at trace.hpp L14-L29:
struct NullTrace {
    static void count(int) noexcept {}
    static void add(int, int64_t) noexcept {}
};

struct CountTrace {
    static constexpr int kSize = 48;
    static inline int64_t values[kSize] = {};
    static void count(int slot) noexcept { values[slot]++; }
    static void add(int slot, int64_t n) noexcept { values[slot] += n; }
};
Because the timed code and the counted code are the same source specialized two ways, NullTrace disappears entirely at compile time and the measured path is unchanged. Run verify and both languages report 35 counters covering every branch, loop iteration and switch arm of the parse and ladder loops.
What the counters do not cover is worth knowing before you trust them: the checksum kernel itself, the SOH-scan implementation, array zeroing, and bounds checks. Those were audited by reading the source, which is a weaker guarantee. It is also an uncomfortable one, because the checksum kernel turns out to be exactly what this article’s causal story is about.
The result: 35 counters, zero divergence, on both operating systems. Same branch counts, same rescan iterations, same scan distances. The counter vectors are committed, not just the claim about them: results/trace-csharp.json against results/trace-cpp.json, plus the two Linux files beside them. Diff them yourself, or run scripts/verify-equivalence.py, which is the four-way comparison in twenty lines.
Here is what that buys. The two hot loops are line-for-line counterparts, and you can diff them by eye. Left is OrderBookWorkload.cs L46-L61, right is order_book.hpp L38-L48:
// C#: OrderBookWorkload.cs
if (e.Side == 0)
{
    TTrace.Count(TraceCounters.BookSideBid);
    bid[idx] = qty;
    if (qty != 0)
    {
        if (idx > bestBid) { TTrace.Count(TraceCounters.BookBidImprove); bestBid = idx; }
    }
    else if (idx == bestBid)
    {
        TTrace.Count(TraceCounters.BookBidRescan);
        int j = idx - 1;
        while (j >= 0 && bid[j] == 0) { TTrace.Count(TraceCounters.BookBidRescanIter); j--; }
        bestBid = j;
    }
}
// C++: order_book.hpp
if (e.side == 0) {
TTrace::count(slot::kBookSideBid);
bid[idx] = qty;
if (qty != 0) {
if (idx > best_bid) { TTrace::count(slot::kBookBidImprove); best_bid = idx; }
} else if (idx == best_bid) {
TTrace::count(slot::kBookBidRescan);
int j = idx - 1;
while (j >= 0 && bid[j] == 0) { TTrace::count(slot::kBookBidRescanIter); --j; }
best_bid = j;
}
}Both sides are allocation-free in steady state, and both prove it rather than asserting it. C# reports 0 gen0 collections everywhere and at most 480 bytes allocated in any timed region, all of it the harness’s own results array and none of it the workload. C++ overrides global operator new/delete and reports 0 allocations, 0 bytes, 0 frees. Both counters live in the harness (Harness.cs, harness.hpp) and are written into every one of the 869 result files, so this is checkable per launch rather than as a summary claim.
Gate 3: the observation is a process launch
One benchmark per process. Eleven independent launches per cell, in randomized order with a fixed seed, pinned to a measured P-core, with cooldowns between. That schedule is scripts/run-matrix.ps1 on Windows and scripts/linux/run-matrix.sh on Linux, and the seven configurations it launches are a seven-line table at L52-L58, environment variables included. If you think a flag is unfair, that is the file to argue with.
The reported number is the median of eleven process medians, and verdicts come from a permutation test on the difference of medians, Holm-corrected, never from eyeballing whether two intervals overlap. That is analyze.py L87 onward.
The fourth gate is smaller but does more work than the other three combined. The comparisons that count are declared in source, before any data existed, at analyze.py L55-L64:
# Canonical pairings, declared BEFORE looking at the data. Only these are compared.
# Picking "best C#" from 6 correlated rows against 1 C++ row would hand C# several
# percent of free min-selection advantage.
CANONICAL = [
    ("order book / idiomatic C#",       "orderbook_l2",   "orderbook_l2_safe"),
    ("order book / tuned C#",           "orderbook_l2",   "orderbook_l2_opt2"),
    ("FIX same-source / idiomatic C#",  "fix_parse",      "fix_parse_safe"),
    ("FIX equal-effort / idiomatic C#", "fix_parse_simd", "fix_parse_safe_simd"),
]
Six C# configurations run against two C++ compilers. Quietly reporting whichever C# cell came out lowest would have handed my own preferred conclusion several free percent. Everything outside that list is printed in a separate, explicitly non-comparative table.
The order book: C++ territory
A direct-indexed L2 price ladder: quantity update, best-level cache, rescan outward when the touch is consumed. One million events. Three C# variants of it live in OrderBookWorkload.cs: Run (idiomatic, L24), RunOpt2 (tuned, L229) and RunUnsafe (pointers, L329). All of them fold the same checksum, and all of them are in the tables below.
Every cell in this section is a row in results/SUMMARY.md, and every interval is a row in results/EQUIVALENCE.md. Both are generated files, not hand-written.
Linux, GCC 13.3 against .NET 10, ns/event:
| implementation | ns/event |
|---|---|
C++ -O3 -march=native |
6.37 |
C# tuned (opt2), like-for-like config |
9.44 |
| C# idiomatic safe, like-for-like config | 10.51 |
| (best C# cell anywhere in the Linux table, post-hoc: 7.74) | 7.74 |
“Like-for-like” here means the config I declared in advance as the fair peer of a C++ compiler with no profile data: DOTNET_TieredCompilation=0. C++ wins by a lot. Against idiomatic C# the gap is +65.0% (p = 0.010, interval [-46.6%, -29.5%]); against tuned C# on the same config it is still +48.2% (p = 0.010). Only against the best cell anywhere in the table, which is a different runtime config I picked after seeing the data, does it narrow to [-29.3%, -5.4%].
Windows is much closer. MSVC 14.44 lands at 7.44 ns/event. There are two declared pairings and they disagree in significance, so here are both: against idiomatic C# (8.42) C++ is +13.2% ahead at p = 0.020, interval [-16.9%, -9.0%]; against tuned C# (7.95) the margin falls to 6.9% at p = 0.066, which does not clear correction.
And the best C# cell in the whole Windows table, tuned C# with tiering left on, lands at 6.94 ns/event, below both C++ builds. I did not declare that pairing in advance, so there is no verdict on it and I am not claiming one. It is a table cell, not a result. What I will say is that the distributions have started to overlap.
I originally wrote that this cell was unfair because it has profile-guided optimization and the C++ builds do not. I cut that, because I could not support it. TieredPGO is at its default in that config, but dynamic PGO collects its profile from tier-0 code, and the very switch that defines this config makes loop-containing methods skip tier-0. Whether those loops got profiled is not something my harness establishes, and I never built the config that would separate tiering from PGO. The honest statement is that this cell differs from the like-for-like one in two ways at once and I cannot attribute the win to either.
The honest read on the order book is: C++ wins, decisively on Linux, and on Windows by a margin that depends on which C# you are willing to write.
One disclosure that matters more than the numbers. This workload is L1-resident: 163 distinct ticks, under 2 KB touched across a million events. My own methodology document claimed it touched 130 KB and exceeded L1, for weeks, until I replayed the fixture and found it was wrong by 138x. That correction is written up as HARNESS.md §7.1 and limitation 9, and you can reproduce the replay in one command with bench-csharp stats, which walks the fixture and reports distinct ticks and resident cache lines instead of asking you to believe a paragraph. It means every order-book number here measures ALU, branch and store throughput with no memory hierarchy involved, which is the configuration that most flatters raw codegen and least resembles a real book under load.
The FIX decoder: a 35% gap that never moves
FIX 4.4 NewOrderSingle: tag scan, integer decode, fixed-point price decode, and full CheckSum validation. Allocation-free on both sides. 200,000 messages. The decoder is one templated function in each language, parameterized on a sum policy and a trace policy, so the only thing that changes between rows is the kernel: FixParseWorkload.cs against fix_parse.hpp.
Write it the way each language’s practitioner would (the obvious scalar loop) and this is the most stable result in the entire project:
| platform | C++ | C# | gap |
|---|---|---|---|
| Windows, MSVC 14.44 | 85.16 ns/msg | 118.29 | C++ +38.9% |
| Windows, MSVC 14.51 | 88.29 | 118.29 | C++ +34.0% |
| Linux, GCC native | 103.99 | 138.84 | C++ +33.5% |
| Linux, GCC v3 | 104.90 | 138.84 | C++ +32.4% |
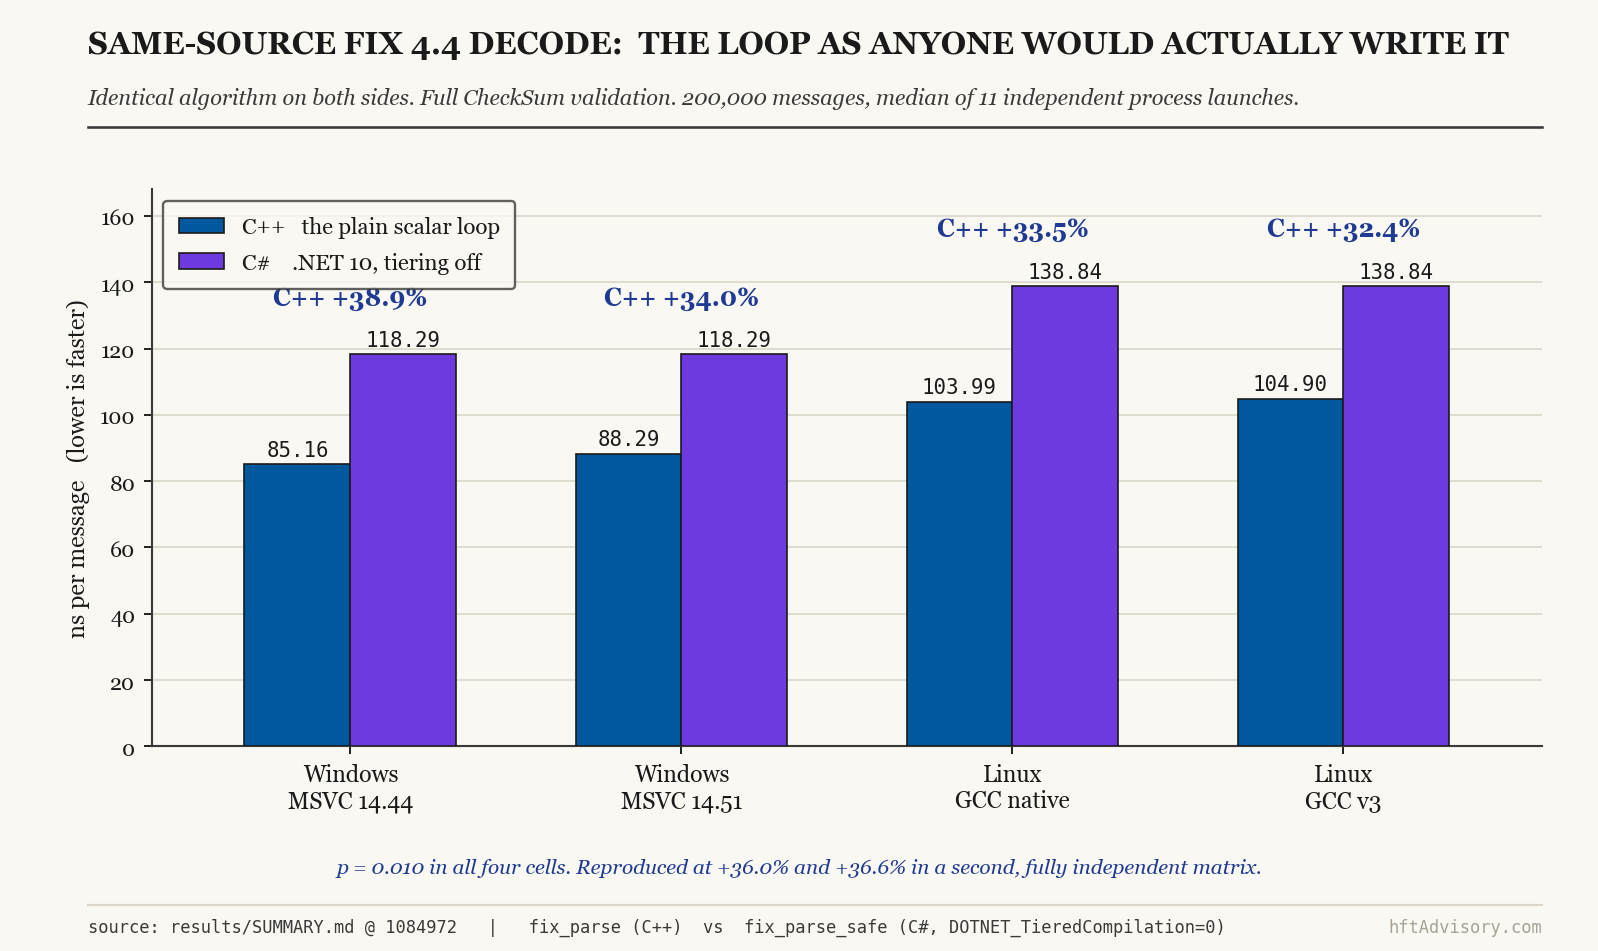
The C# column is jit-tc0, tiering off and no profile data, which is the config I declared in advance as the fair peer of a C++ compiler without PGO. Four measurements, two operating systems, two compilers, p = 0.010 everywhere. And it reproduced at +36.0% and +36.6% in a completely separate matrix run on a different afternoon.
C++ is roughly a third faster, and it is not close. If you stopped reading here you would conclude I was right to laugh.
Why: .NET has no auto-vectorizer
Almost all of the gap lives in one loop, the CheckSum byte sum, which re-reads essentially the whole message.
I can put a number on “almost all”, because the harness has a variant with CheckSum validation removed on both sides, gated on its own checksum oracle. That is the NoSum policy, fix_parse.hpp L125-L128 and its C# counterpart, and it produces the fix_parse_nosum rows in the summary. With validation on, C++ leads by 33.13 ns/msg. With it off, the lead drops to 4.08. The byte-sum loop is 88% of the gap against MSVC 14.44 and 80% against 14.51. The remaining 4 to 6 ns/msg is the parser proper (the tag scan and the integer decode) where C++ stays 2.3% to 9.3% ahead. Real, but not the story.
Here is the loop that matters. C# first, FixParseWorkload.cs L20-L31, then C++ at fix_parse.hpp L85-L92.
public struct ScalarSum : ISumPolicy
{
    public static int Sum(ReadOnlySpan<byte> s)
    {
        int total = 0;
        for (int i = 0; i < s.Length; i++) total += s[i];
        return total;
    }
}
struct ScalarSum {
[[nodiscard]] static int sum(const uint8_t* s, int n) noexcept {
int total = 0;
for (int i = 0; i < n; ++i) total += s[i];
return total;
}
};Identical loops. But look at what MSVC emits for the C++ version. This is verbatim from the compiler’s own listing, including its source-line annotation, so you can see which line it is compiling:
; 89   :         for (int i = 0; i < n; ++i) total += s[i];
    ...
$LL4@sum:
    vpmovzxbd ymm1, QWORD PTR [rcx]
    vpaddd    ymm2, ymm1, ymm2
    vpmovzxbd ymm1, QWORD PTR [rcx+8]
    add       rcx, 16
    add       r11d, 16
    mov       rax, rcx
    sub       rax, r10
    vpaddd    ymm3, ymm1, ymm3
    cmp       rax, rdx
    jl        SHORT $LL4@sum
; then a horizontal reduction: vphaddd, vextracti128, vpaddd
; then a scalar tail at $LL18@sum for the last bytes
The C++ compiler recognized the reduction and vectorized it into 256-bit AVX2 registers, for free, because the developer wrote a for loop. RyuJIT emits a scalar loop, because .NET has no auto-vectorizer.
Two caveats on my own evidence, since this is the article’s one piece of causal proof.
An earlier version of this section quoted a loop labelled $LL7@sum. That label lives inside HandSimdSum, the hand-written SIMD routine, where MSVC had auto-vectorized its sub-32-byte scalar tail. Both functions contain vpmovzxbd, so the grep that produced the excerpt could not tell them apart. The loop above is the right one, from ScalarSum. The fix was to stop grepping: scripts/extract_asm_evidence.py now finds the PROC..ENDP span for a named mangled symbol and emits all of it, in order, with nothing removed. Both complete functions are published at results/asm-msvc1444-evidence.txt, so you can check the mapping rather than trusting my excerpt, and the script’s own docstring records the mistake so nobody repeats it.
And there is no tier-1 RyuJIT disassembly of ScalarSum.Sum in the repo. The .NET team states plainly that auto-vectorization is not implemented, and the timing gap is consistent with it, but I am showing you MSVC’s optimized output and asking you to take RyuJIT’s on the strength of the vendor’s own statement plus a measurement. That is the weaker half of the argument, and you should know which half is which.
This is not an oversight and it is not new. The .NET team closed the auto-vectorization request (dotnet/runtime#11263) in November 2020 with an explicit statement of intent: “The JIT team would love to spend more time thinking about auto-vectorization, but it is unlikely to happen in the near or even mid-term future. And its impact, while potentially great, though very narrow, can also be somewhat achieved using the now-existing hardware intrinsics.” .NET 10’s runtime release notes list eleven JIT improvements: devirtualization, escape analysis, stack allocation, code layout, inlining, AVX10.2 intrinsics. Auto-vectorization is not among them.
The fix is to write the vector code yourself. About ten lines, at FixParseWorkload.cs L40-L70:
public struct SimdSum : ISumPolicy
{
    public static int Sum(ReadOnlySpan<byte> s)
    {
        int n = s.Length, i = 0, total = 0;
        if (Avx2.IsSupported && n >= 32)
        {
            ref byte origin = ref MemoryMarshal.GetReference(s);
            Vector256<ulong> acc = Vector256<ulong>.Zero;
            int limit = n - 32;
            for (; i <= limit; i += 32)
            {
                Vector256<byte> v = Vector256.LoadUnsafe(ref origin, (nuint)i);
                acc += Avx2.SumAbsoluteDifferences(v, Vector256<byte>.Zero).AsUInt64();
            }
            Vector128<ulong> sum128 = Sse2.Add(acc.GetLower(), acc.GetUpper());
            total = (int)(sum128.GetElement(0) + sum128.GetElement(1));
        }
        for (; i < n; i++) total += s[i];
        return total;
    }
}
To keep it an equal contest I wrote the same _mm256_sad_epu8 kernel on the C++ side too, fix_parse.hpp L96-L123, so the comparison is the same algorithm rather than my hand-written SIMD against the compiler’s. Read the comment block in the middle of that function while you are there: it records a 32-byte store followed by 8-byte loads that could not store-forward, costing roughly 12 to 15 cycles per message, on the one pairing where the two languages came out level. It handicapped C++, so it was removed rather than left in.
One honest asterisk on that C# kernel: MemoryMarshal.GetReference plus LoadUnsafe elides bounds checks, so it is not “safe code” in the strict sense. The fully bounds-checked version using Vector256.Create(span.Slice(i, 32)) is the SimdSumCreate policy at L85 of the same file. It is measured alongside, and it is the faster of the two in three of five configurations, so nothing here depends on the unsafe load.
That change moves C# from 118.29 to 91.63 ns/msg. A 35% deficit becomes single digits.
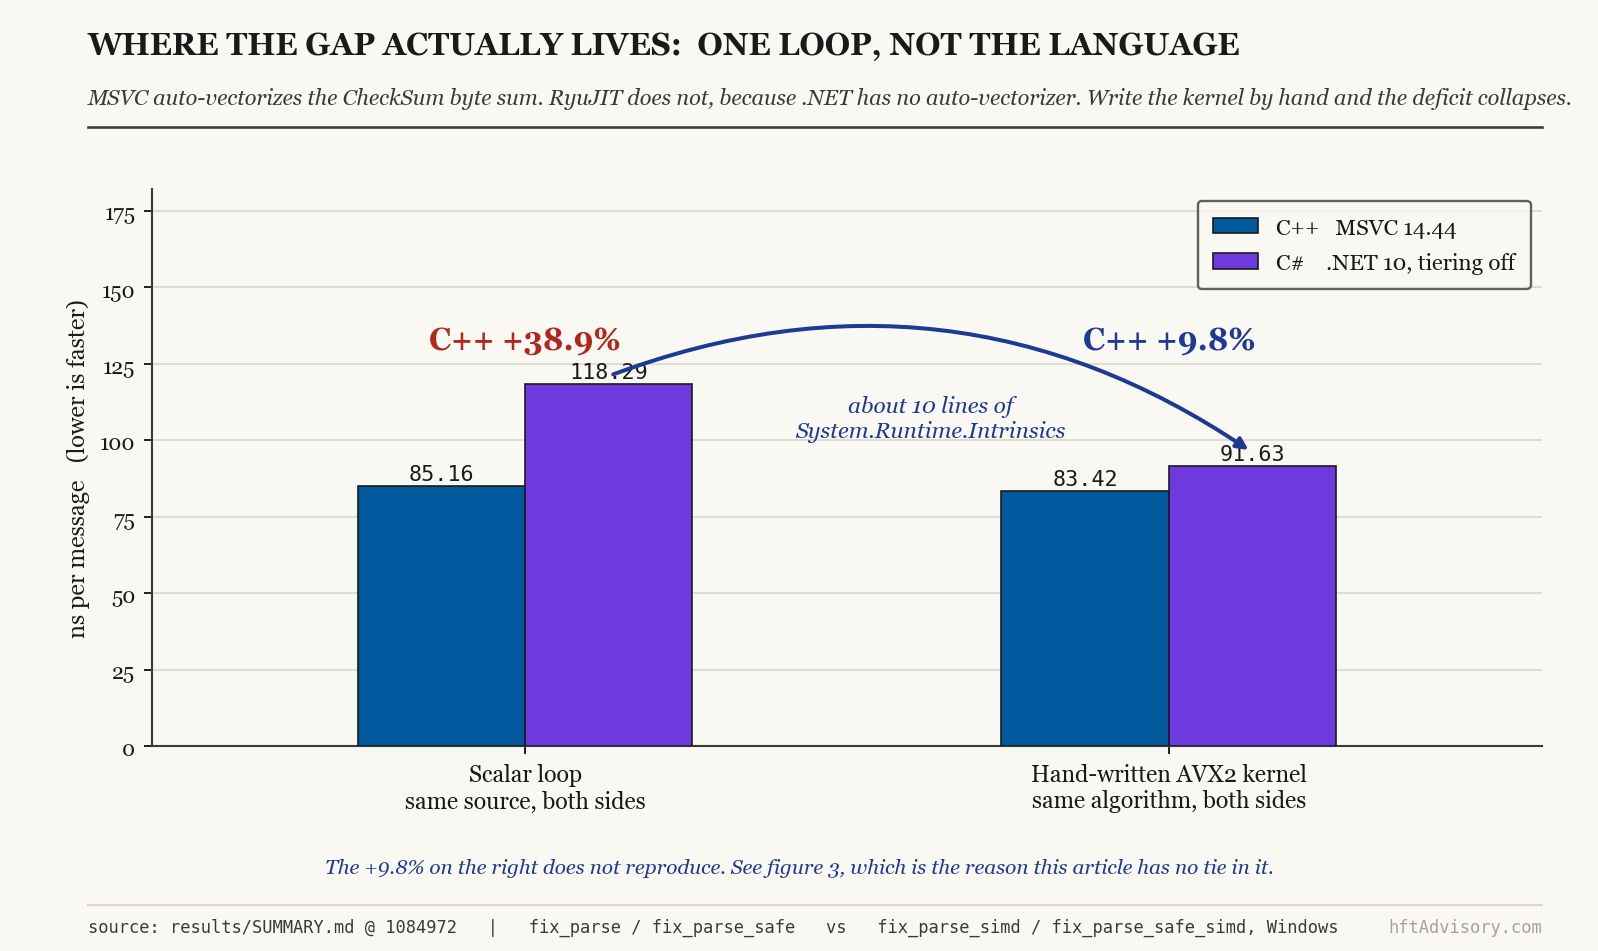
Note what did not move. C++ went from 85.16 to 83.42, a shade over 2%, because MSVC had already written that kernel for it. The entire change is on the C# side, and all of it is one function.
The run that killed my headline
Here is where I had my article. C# ties C++ on the decode path. Order book still belongs to C++. Controversial, defensible, done.
Then I re-ran the entire matrix.
Not a different benchmark. The same Windows binaries, same flags, same everything, on a different afternoon. Purely to check that the verdicts reproduced.
Comparing two matrices needed a tool that did not exist, so scripts/between_runs.py pulls the earlier matrix straight out of git history with git archive, separates the uniform machine-speed shift from the residual spread, and reports which verdicts survived. Its output is results/REPRODUCIBILITY.md.
Gap below is C# relative to C++, so a positive number means C++ is faster.
| pairing | matrix A | matrix B | stable? |
|---|---|---|---|
| FIX same-source (14.44) | +36.0% | +38.9% | stable |
| FIX same-source (14.51) | +36.6% | +34.0% | stable |
| FIX parser only, no checksum (14.44) | +5.2% | +4.7% | stable |
| FIX parser only, no checksum (14.51) | +9.5% | +7.0% | stable |
| Order book (14.51) | +13.7% | +10.5% | stable |
| Order book (14.44) | +23.6% | +13.2% | same direction, 10pp swing |
| FIX equal-effort (14.51) | +2.5% | +9.7% | same direction, 7pp swing |
| FIX equal-effort (14.44) | -2.6% | +9.8% | SIGN FLIPPED |
Every verdict reproduced except one, and the one that did not was the exact pairing my headline rested on. Note the row above it too: the same pairing against the other compiler held its direction but moved 7 percentage points, which is its own warning.
It gets worse for the tie. A large p-value cannot tell “the same” apart from “too noisy to tell”, so I wrote scripts/equivalence.py, which inverts the same permutation test to bound the true difference instead of just failing to reject it. Every row it produces is classified separated, equivalent within a stated bound, or unresolved, and it is honest enough to label its own rows unresolved. Here are three measurements of that same pairing as intervals rather than as a percentage gap. Note the sign convention inverts: below, a negative number means C++ is ahead, because the interval is on C++ time minus C# time and being faster means taking less time.
| measurement | 95% interval on (C++ time minus C# time) | says |
|---|---|---|
| Windows, matrix A | [-2.9%, +4.0%] | a tie |
| Windows, matrix B | [-9.9%, -7.7%] | C++ ahead ~9% |
| Linux, GCC native | [+2.6%, +18.8%] | C# ahead ~7% |
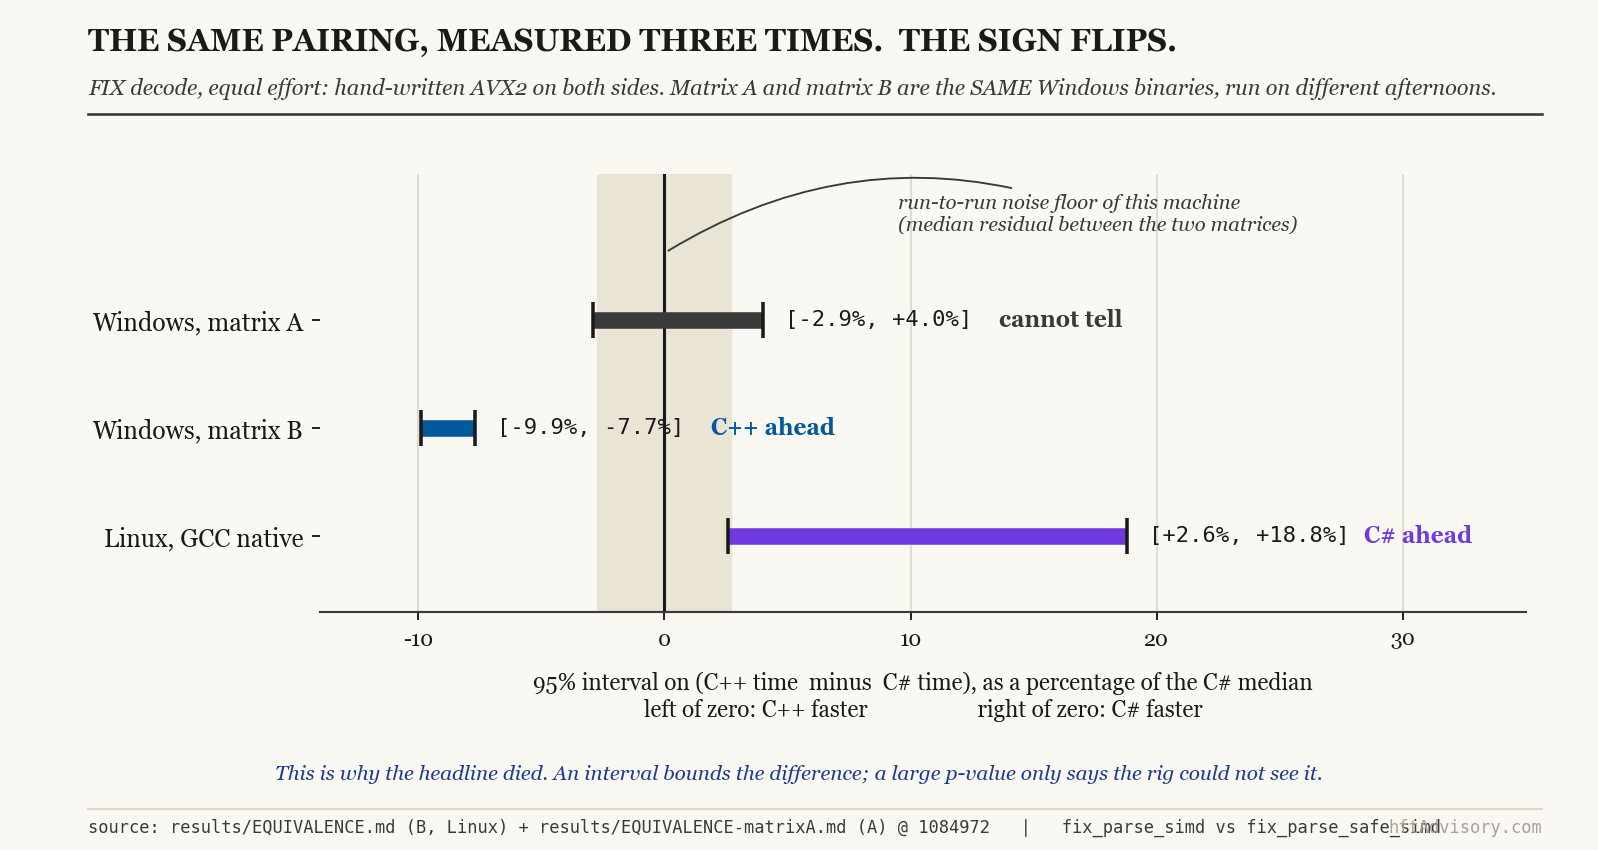
Three answers. Including a sign flip between two runs of identical binaries, and a second sign flip between platforms.
Writing this article turned up a gap in my own repo, which is worth naming because it is the failure mode this whole piece is about. REPRODUCIBILITY.md compared the two matrices as point estimates only. Matrix A’s intervals had been computed and then never published, so a reader could open the run that overturned the tie but not the run that produced it. Since the disagreement between the two is the result, both halves have to be openable. Matrix A’s intervals are now committed at results/EQUIVALENCE-matrixA.md, regenerated by running the unmodified equivalence.py against the archived matrix, with the reproduction command in the file header.
The machine ran 5.2% faster overall in matrix B, a uniform shift that cancels inside a run because both languages are measured under it. What does not cancel is the spread around it, and that residual has a median of 2.7 percentage points and a maximum of 11.1. That is the floor on any claim this rig can make, and it is wider than the effect I was about to publish.
So “C# ties C++ on the FIX decoder” was never a finding. It was one draw from a distribution.
What I can defend is narrower and, I think, more useful:
Roughly ten lines of
Vector256turn a reproducible 35% deficit into a difference too small for a pinned, thermally-controlled laptop to resolve consistently, sometimes favoring C++ and sometimes C#, depending on platform and machine state.
That is not parity. It is the gap ceasing to be the thing that decides your architecture.
Three things that surprised me more than the verdict
1. The default JIT settings cost 7.72x, and Microsoft’s docs are wrong about it
The same FIX decoder, same binary, stock .NET settings: 964.13 ns/msg. With TieredCompilationQuickJitForLoops disabled: 124.85.
The runtime starts loop-containing methods in unoptimized tier-0 code and relies on On-Stack Replacement to promote them. On a hot path that a benchmark hammers immediately, it frequently does not get there in time. The disassembly is checked in at results/jitdisasm-simdsum.txt and it is unambiguous: ; Instrumented Tier0 code and ; compiling with minopt, on the exact method the benchmark spends its time in.
Worse than the magnitude is the inconsistency. Matrix A was bimodal: five launches at 125 to 148 ns/msg and six at 966 to 1011, with nothing in between. Matrix B was slow on all eleven. Across both, the penalty fired on 17 of 22 process starts. For a trading system that reloads on failover, “usually 7x slower, occasionally not” is a far worse property than a predictable 7x. This is the one claim in the article you can verify without running anything: open the eleven results/proc-jit-default-fix_parse_safe-*.json files and read the medians. The bimodality is visible by eye.
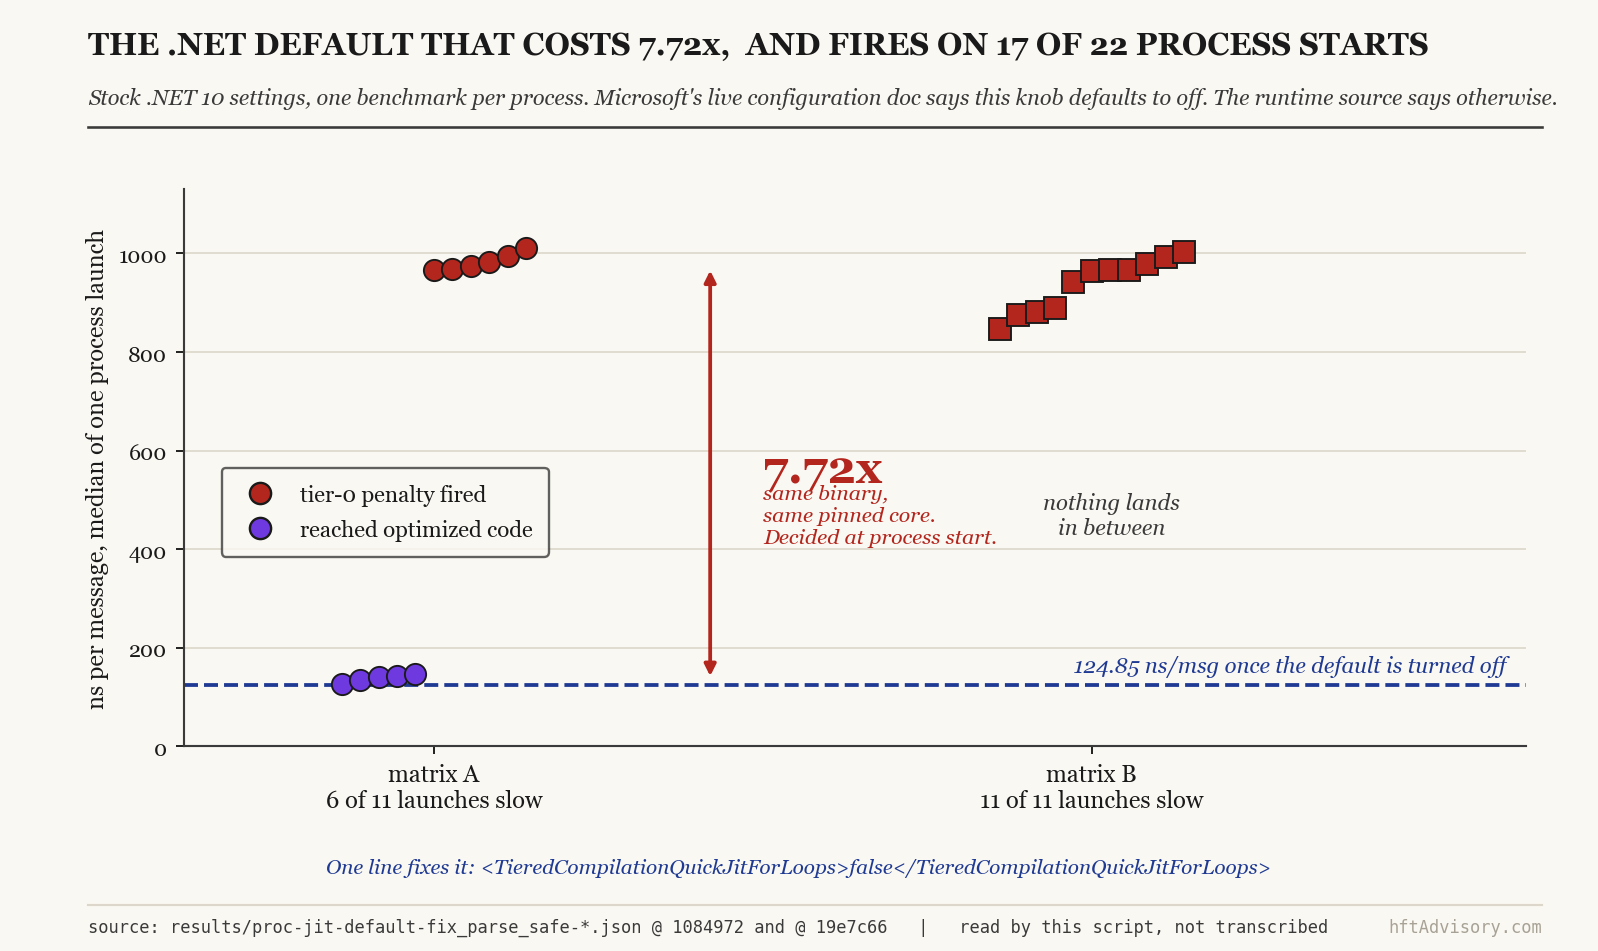
That figure is generated by reading those files, not by transcribing them. The gap in the middle is the point: there is no gradual degradation to tune against. Each process either reaches optimized code or it does not.
And here is the part that should bother anyone running .NET in production. Microsoft’s own configuration documentation states: “If you omit this setting, quick JIT is not used for methods that contain loops. This is equivalent to setting the value to false.” That page is dated 2021-10-29. The runtime source (src/coreclr/inc/clrconfigvalues.h) sets the default to 1 whenever FEATURE_ON_STACK_REPLACEMENT is defined, which it is:
#ifdef FEATURE_ON_STACK_REPLACEMENT
RETAIL_CONFIG_DWORD_INFO(UNSUPPORTED_TC_QuickJitForLoops, W("TC_QuickJitForLoops"), 1, ...)
#else
RETAIL_CONFIG_DWORD_INFO(UNSUPPORTED_TC_QuickJitForLoops, W("TC_QuickJitForLoops"), 0, ...)
#endif
The documentation predates OSR by a year. The measurement agrees with the source, not the doc. The fix is one line in a csproj:
<TieredCompilationQuickJitForLoops>false</TieredCompilationQuickJitForLoops>2. unsafe and pinning made C# slower
Every C# developer’s instinct for a hot loop is to reach for unsafe, fixed, and raw pointers. I wrote that variant. It never won.
In matrix A the difference was undetectable (p = 0.819). In matrix B it was significantly slower: 8.42 vs 9.33 ns/event on the like-for-like config (p = 0.001) and 7.69 vs 8.63 with stock settings (p = 0.018).
I do not have a mechanism for this. No disassembly in the repo isolates it. The plausible story is that fixed pins the array and pinning inhibits optimizations a moving managed ref does not, but I am inferring that from timing rather than from codegen. The unsafe row is also the least reproducible cell in the entire matrix, moving 11.1 percentage points between the two runs. Read it as: unsafe bought nothing here, twice. Not as: pinning is why.
The tuned variant that actually won uses a moving managed reference, which removes bounds checks without pinning. Compare RunOpt2 at L240 against RunUnsafe at L329 in the same file, where the three fixed statements are:
ref BookEvent ev = ref MemoryMarshal.GetReference(events);
ref BookEvent evEnd = ref Unsafe.Add(ref ev, events.Length);
ref long bid0 = ref MemoryMarshal.GetReference(bid);
while (Unsafe.IsAddressLessThan(ref ev, ref evEnd))
{
    // ...
    ev = ref Unsafe.Add(ref ev, 1);
}
3. Suppressing the garbage collector changed nothing
This is the objection every architect raises first, so I tested it with GC.TryStartNoGCRegion held open across the entire measured region. That call reserves an allocation budget rather than switching collection off, and it can fail silently, so Bench.Runner/Program.cs records both noGcRequested and noGcActive, and samples GCSettings.LatencyMode inside the timed region rather than before it. Every result file carries that provenance string, so the claim “the GC was actually suppressed” is checkable per launch instead of being an assertion about a flag I passed.
Result: -2.2% on the FIX decoder (p = 0.669) and +0.2% on the order book (p = 0.730). Nothing.
Which should be obvious in hindsight: the hot path allocates zero bytes, and a collector with nothing to collect costs nothing. The GC is not what makes .NET slow on these paths. The absence of an auto-vectorizer is, and a JIT tiering default is.
4. NativeAOT lost to the JIT
The other reflex, after “turn off the GC”, is “compile it ahead of time”. NativeAOT removes the JIT entirely, produces a native binary, and starts instantly. It should win.
It did not. On the FIX decoder, NativeAOT ran at 99.59 ns/msg against 88.38 for the best JIT configuration (that 88.38 is jit-qjfl-nogc; the 91.63 quoted earlier is the like-for-like jit-tc0, a different config in the same matrix). On the order book, 8.04 against 6.94. Linux agreed: 100.21 and 9.09. AOT lost on both workloads, on both operating systems, by 13% to 16%.
The reason is the thing everyone forgets about a JIT: it compiles for the processor it is actually running on, and it gets dynamic profile-guided optimization for free. NativeAOT has to commit to an instruction set at build time and has no profile to work from. That commitment is one line, Bench.Runner.csproj L18: build-csharp.cmd, build-cpp.cmd, linux/build.sh) so you can compare exactly what each toolchain was told to do. AOT buys deterministic startup, a smaller deployment, and no tier-0 cliff, which for a failover-sensitive system may well be worth 13%. It does not buy peak throughput.
What I would actually tell the CTO
If a decision about a trading stack lands on your desk tomorrow, this is the diagnostic I would run before anyone writes a line of code.
Separate the paths by what dominates them. A FIX or market-data decoder is dominated by byte-level reductions and scans. That is exactly where the compiler’s auto-vectorizer earns its 35%, and exactly where ten lines of System.Runtime.Intrinsics claws it back. An order book is dominated by branchy pointer-chasing and cache behavior. C++ won that on every configuration I measured that was a fair fight.
Fix the configuration before you blame the language. A 7.72x tiering penalty on most process starts dwarfs every language difference in this article. Set TieredCompilationQuickJitForLoops=false, measure allocation in the hot path and drive it to zero, and only then compare.
Do not reach for unsafe first. It lost or tied in every variant I tried. Use a managed ref cursor instead.
Stop arguing about the GC on throughput. If your hot path allocates, fix that. If it does not, the collector is not costing you nanoseconds. Pause distributions under allocation churn are a separate and entirely real question, and this benchmark does not touch them.
Then set your own threshold. The honest question is not “which is faster”. It is “is the remaining gap larger than what I gain in delivery speed, hiring pool, and operational tooling?” For a decoder, the answer turns on one decision. Hand-write the vector kernel and the remainder is inside the noise of the machine it runs on. Skip it, and write the obvious loop that actually ships, and the gap is a reproducible third. For a matching engine’s book, C++ wins on every fair configuration I measured.
What I still do not know
I want to be precise about the limits, because a benchmark that only reports its wins is marketing.
The ISA targeting is not symmetric, and it runs against C++ on exactly the pairings that came out closest. GCC gets -march=native, but MSVC gets a generic /arch:AVX2 while RyuJIT compiles for the processor it is actually running on. So on Windows the C# side is effectively -march=native and the C++ side is not.
This is one laptop, one microarchitecture, no AVX-512, with the Linux runs inside WSL2. There is no clang. The order book is L1-resident, so nothing here says anything about cache behavior under a realistic multi-symbol load. That variant is the obvious next build and it does not exist yet. Nothing measures GC pause distributions under allocation churn, tail latency, startup on failover, or memory footprint. And the C++ side calls memchr out-of-line through the CRT while C# inlines IndexOf, an asymmetry that runs against C++ on the one pairing where the two came out level.
And the entire other half of the decision is absent. When I say “set your own threshold” in the section above, I hand you data for exactly one side of it. Delivery velocity, defect rates at thirty engineers, the hiring pool, production profiling and observability tooling, whether a hand-written AVX2 kernel survives contact with a team that rotates: none of that is measured here, and for most organizations those dominate a 10% throughput difference. I am not going to pretend a laptop benchmark speaks to them.
If you think one of these invalidates a conclusion, you do not have to rebuild anything to check. Clone the repo, and:
python scripts/analyze.py           # every cell, plus the pre-declared verdicts
python scripts/equivalence.py       # intervals on the difference, not just p-values
python scripts/between_runs.py 19e7c66   # matrix A vs matrix B, straight out of git history
Those three commands regenerate SUMMARY.md, EQUIVALENCE.md and REPRODUCIBILITY.md from the 869 committed per-launch JSON files, each carrying its own checksum, allocation counters and runtime provenance. No compiler required. One disclosure on that: the p-values in surprises 2 and 3 are one-off comparisons I ran by hand against the same raw files, not output of the generated reports.
The most useful thing you can do with this repo is break it. An adversarial review already broke five of my claims before publication, including a methodology section that asserted a 130 KB working set for a workload that touches 1.4 KB. Those corrections are in the commit history rather than quietly edited away, because a benchmark whose author never publishes a retraction is a benchmark whose author never checked. If you find the sixth, open an issue.
github.com/silahian/hft-dotnet-vs-cpp
I laughed when I was asked to build an HFT system in C#. I was right about the order book. I was right about the decoder too, as anyone would actually write it, where C++ holds a reproducible third. What I had wrong was that the decoder gap was structural. It was one loop, and about ten lines closed it. And I was wrong about what threatens a .NET trading system in production, which was never the garbage collector.
I advise trading firms on the infrastructure decisions that commit capital: execution quality, latency, and build versus buy. If your own language or platform debate is running on assertions rather than a checksum oracle and a permutation test, that is the gap worth auditing first. Details at hftAdvisory.com.
Never Miss an Update
Get notified when we publish new analysis on HFT, market microstructure, and electronic trading infrastructure. No spam.
Subscribe by EmailAriel Silahian is a senior technology executive in institutional electronic trading, with 30+ years across the buy and sell side (New York, Miami, London, Hong Kong). He is the author of "C++ High Performance for Financial Systems" (Packt) and the creator of VisualHFT, the open-source microstructure analytics stack. He writes on exchange architecture, market microstructure, and execution quality, and advises a select number of trading firms on infrastructure decisions that move P&L. Book a strategy call at hftAdvisory.com