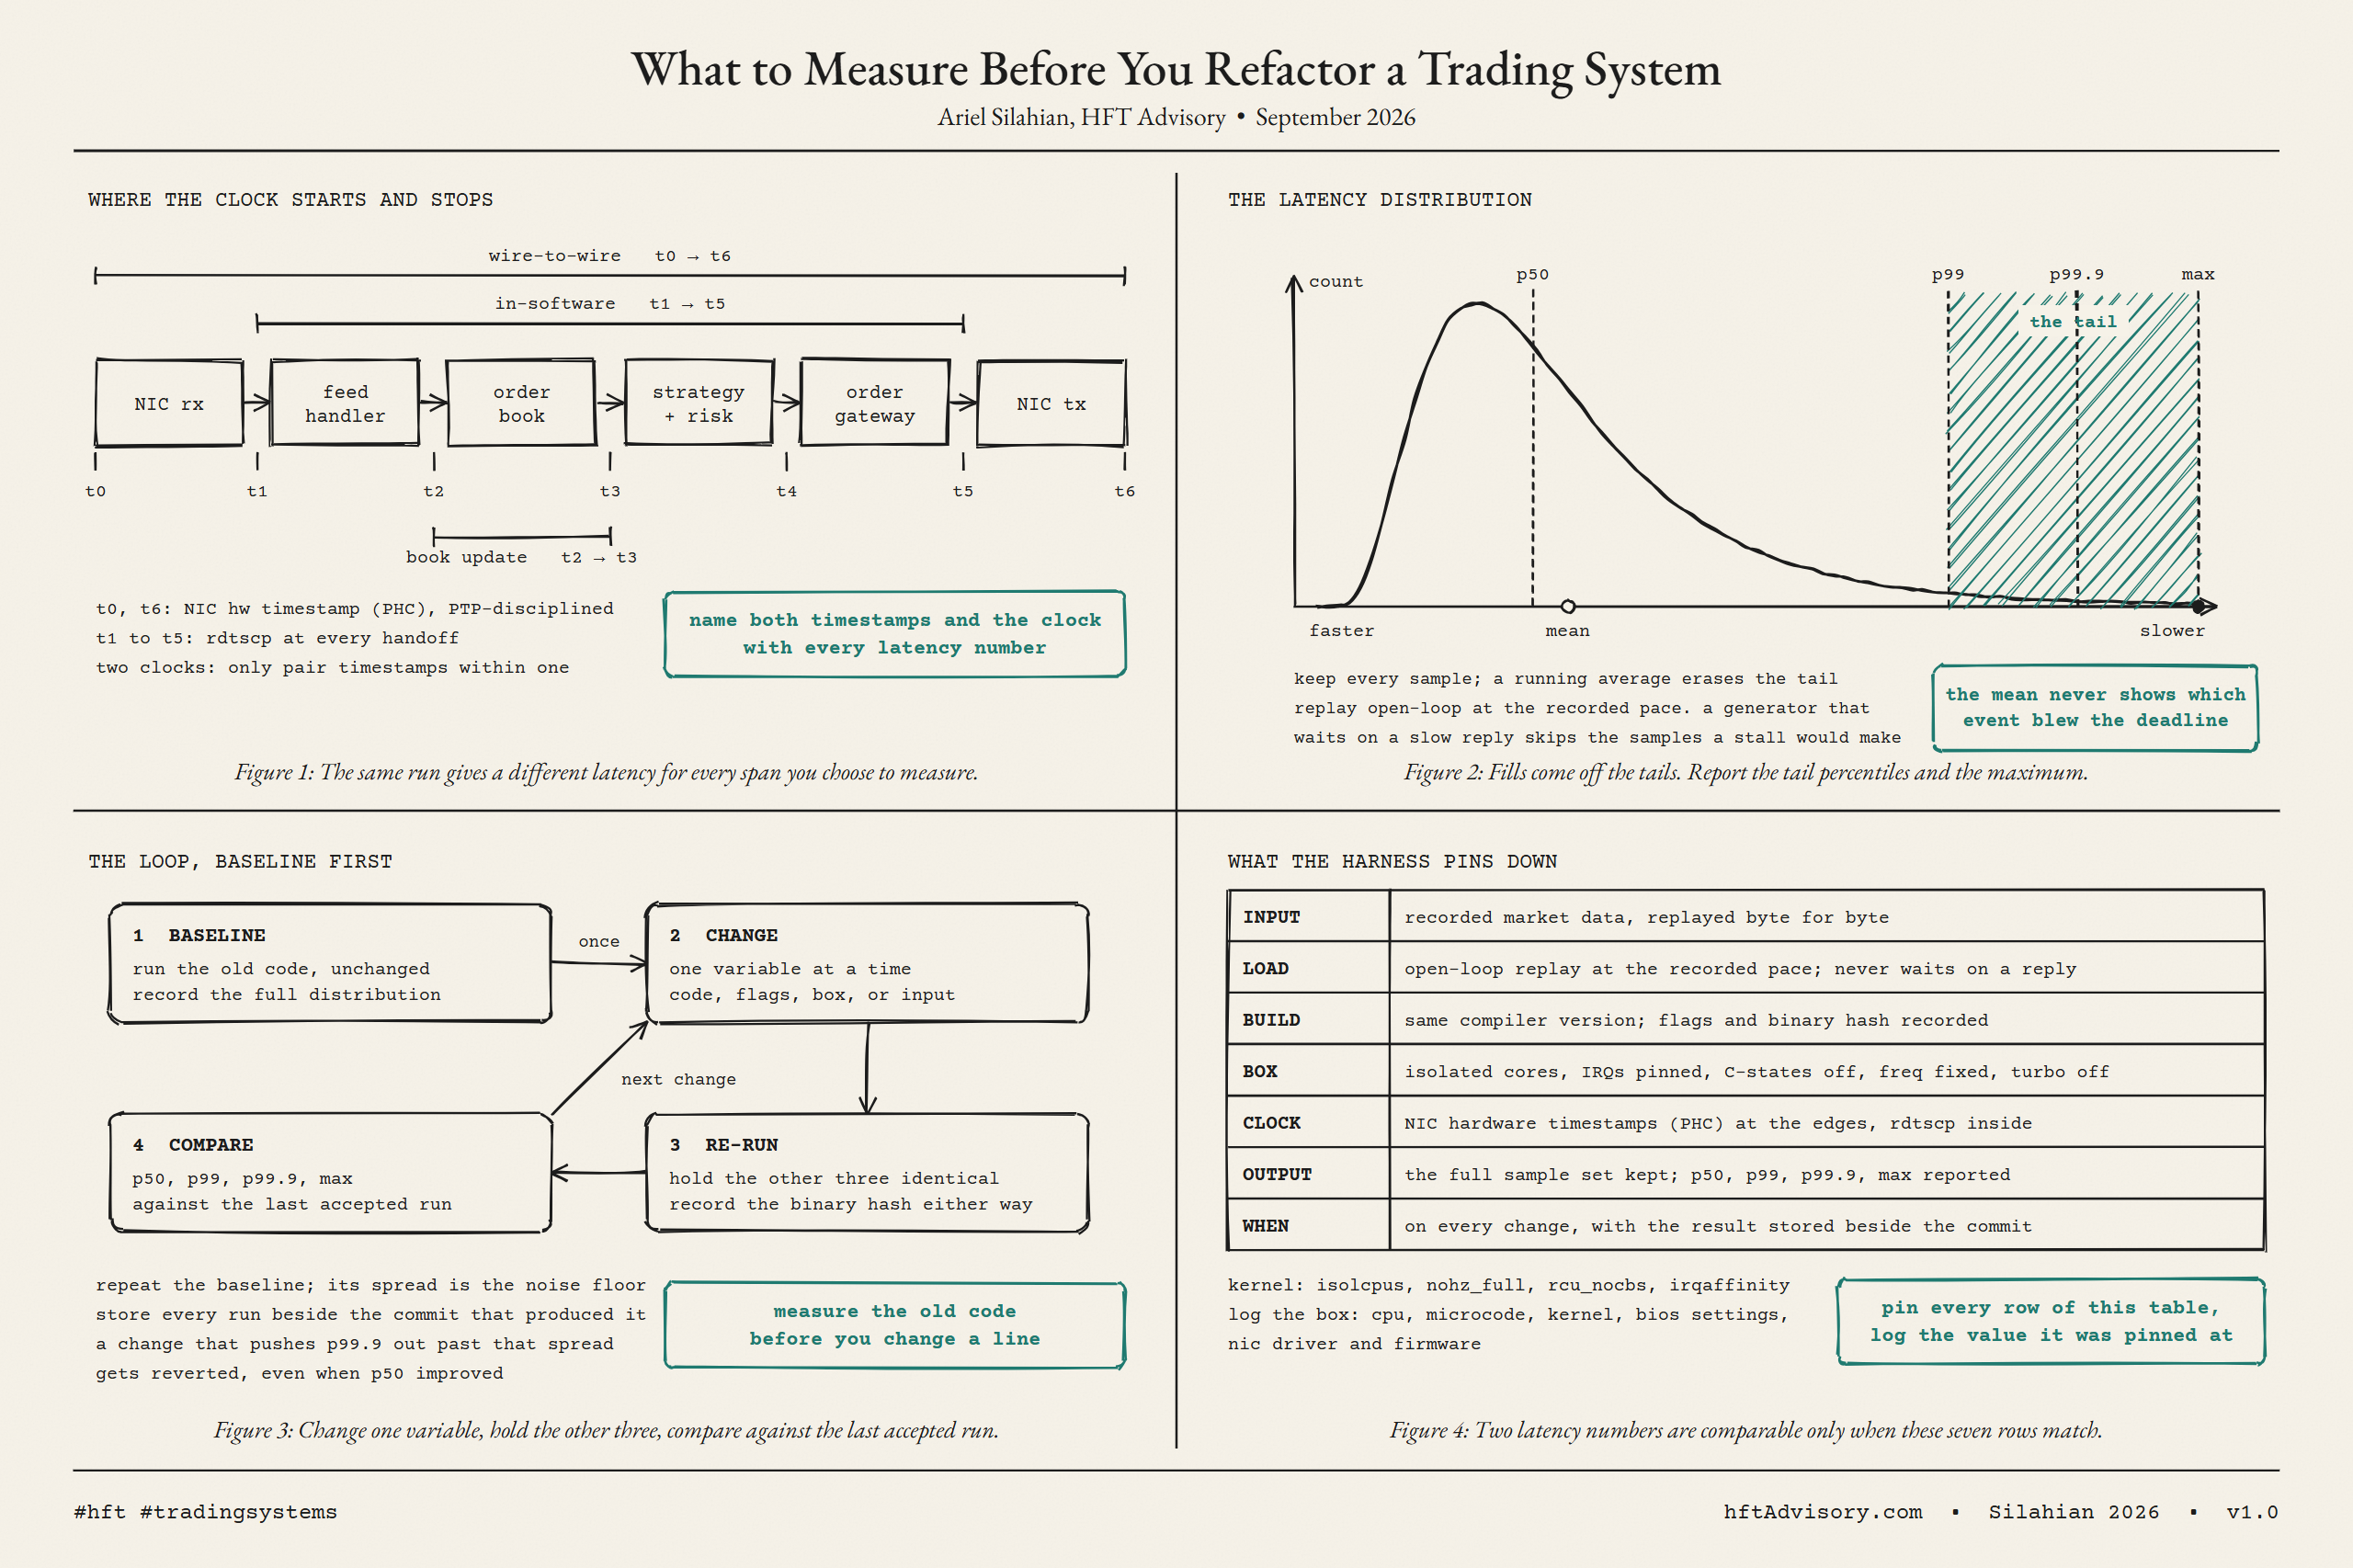
While benchmarking C# against C++ for a FIX decoder and an order book, one configuration default cost more than the language choice itself. The same binary, launched the same way, ran 7.72 times slower on most starts than on the rest, with no code change and no visible cause until I went looking for one. This article is that search, narrowed to one setting: TieredCompilationQuickJitForLoops.
Everything below traces to the public repo behind the original benchmark: github.com/silahian/hft-dotnet-vs-cpp. Every figure is generated from the committed per-launch result files, not transcribed from a table.
Table of contents
- The measurement that should not have been possible
- What tier-0 and quick JIT actually mean
- Why loops are special: On-Stack Replacement
- Watching the run get faster mid-flight
- The documented default
- The compiled default
- Nobody has filed this
- A closed issue asking for exactly this data
- Which hot paths are actually exposed
- What you give up by turning it off
- What to do on Monday
- What is still open
The measurement that should not have been possible
The workload is a FIX 4.4 decoder: tag scan, integer decode, fixed-point price decode, checksum fold, 200,000 messages per run. The environment is .NET 10.0.10, win-x64, pinned to a single physical core, Batch GC latency mode. Eleven independent process launches per configuration, cooldowns between them, nothing else running on the machine.
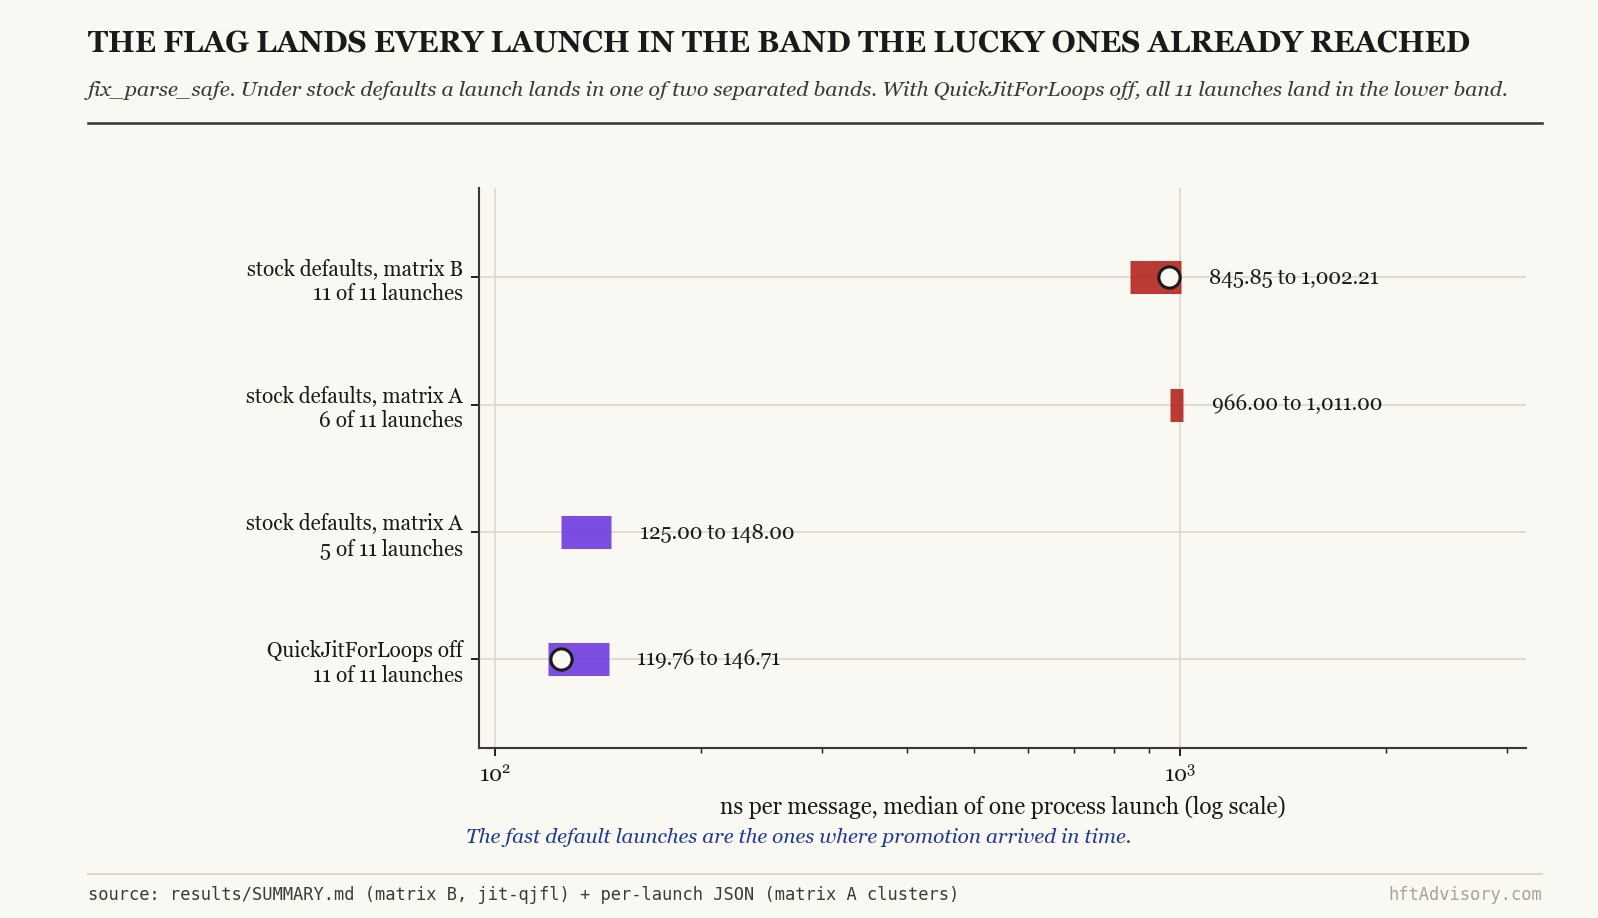
With the runtime’s stock settings, that decoder ran at a median of 964.13 ns per message, with an 11-launch range of 845.85 to 1002.21. With TieredCompilationQuickJitForLoops set to false, the same binary ran at 124.85 ns per message, range 119.76 to 146.71. That is a 7.72x gap between two runs of code that never changed.
In capacity terms, which is the form the number actually matters in: one core decodes about 8.01 million messages per second at 124.85 ns, and about 1.04 million at 964.13 ns. The extra 839.28 ns per message is the whole difference. A gateway taking 500,000 messages per second spends an additional 42 percent of a core on decode alone. Nothing in the service’s own code or its own configuration file accounts for it.
What took longer to accept than the ratio was the inconsistency. Across two separate 11-launch matrices run on different days, the penalty fired on 17 of 22 process starts. The first matrix was bimodal: five launches landed in the 125 to 148 ns band, six landed in the 966 to 1011 ns band, and nothing fell between them. The second matrix was slow on all eleven. A trading process that restarts on failover, redeploys under a canary, or simply gets recycled by an orchestrator does not get to pick which cluster it lands in.
Thank you for reading this post, don't forget to subscribe!
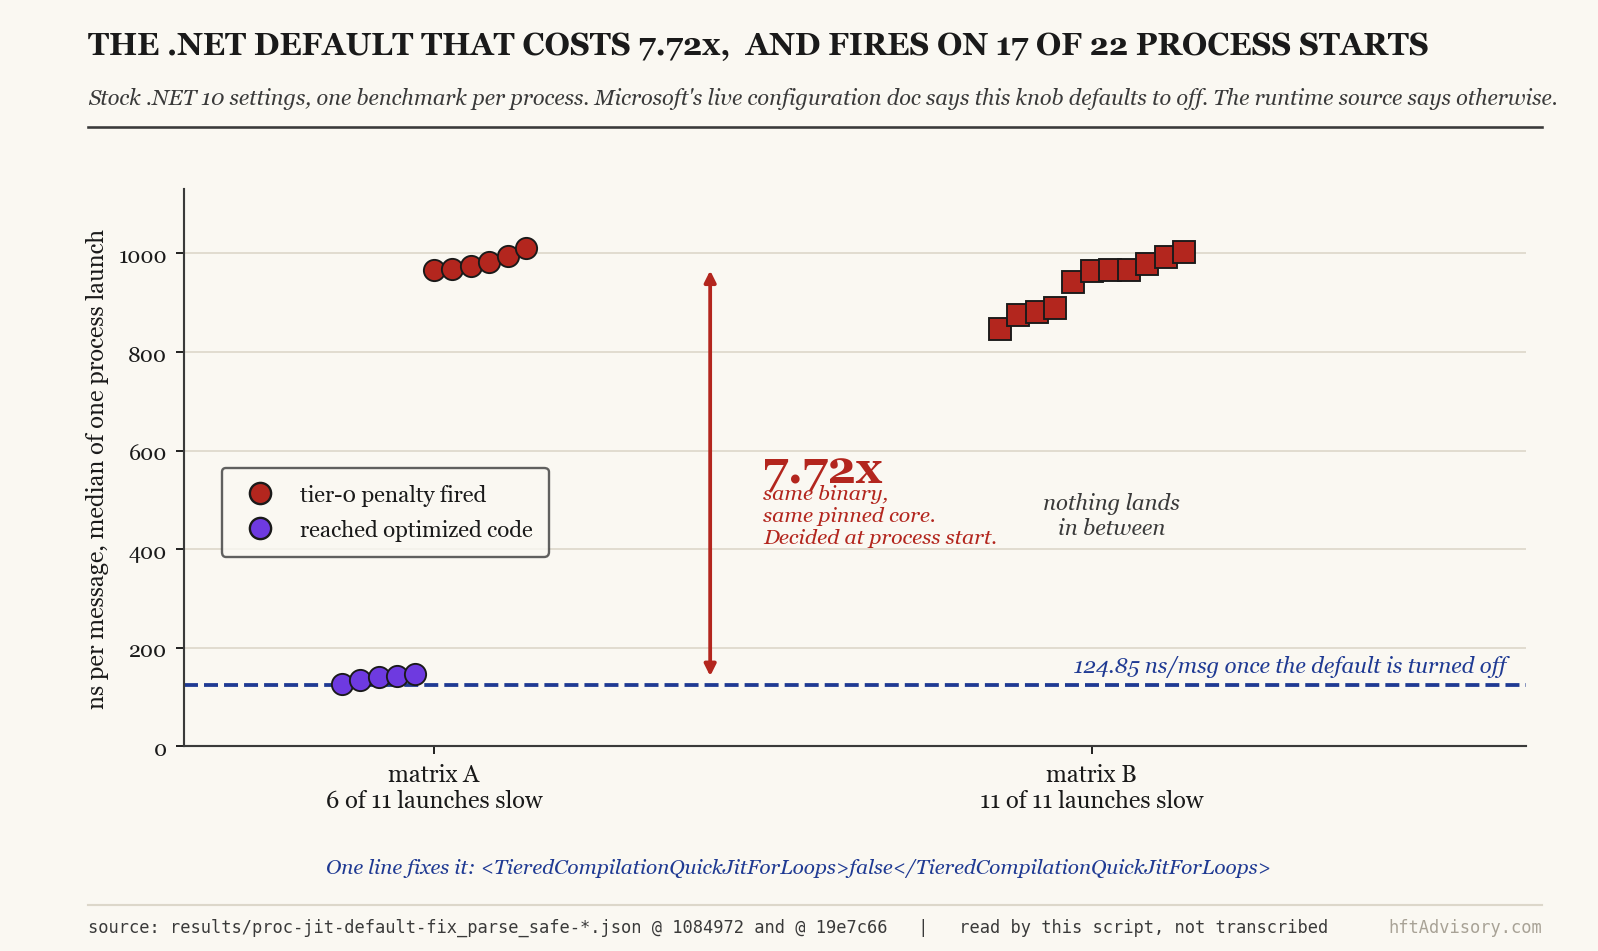
The gap in the middle of that plot is the finding. There is no gradual slowdown to tune against here. A process either reaches the fast band or it sits in the slow one for the length of its run.
What follows was measured on .NET 10.0.10, win-x64, on bare metal, on one machine. It was not measured on .NET 11, which is the version the runtime maintainers most recently tested this against. It was not measured on Linux, inside a container, or on a trimmed or Native AOT build. Native AOT in particular removes the entire mechanism described here, because it does not JIT at runtime at all. Where those environments land is genuinely unknown to me, and I would rather say so than let the ratio travel further than the measurement does.
What tier-0 and quick JIT actually mean
RyuJIT compiles a method twice under tiered compilation. The first compile, tier-0, is fast to produce and deliberately unoptimized, so the process starts serving requests quickly instead of waiting on a slow optimizing compile for every method it happens to touch. If a method keeps getting called, the runtime promotes it to tier-1, the fully optimized version, and swaps it in for future calls.
Promotion is driven by a call counter, and the default policy requires roughly 30 calls plus a 100ms window during which the runtime will not jit anything new, before a method becomes eligible for tier-1 at all. That threshold works for methods that get hot by being invoked often. The runtime’s own design documentation names the gap directly: “The call counter may not adequately address cases where methods are hot by virtue of containing loops, even if they aren’t invoked many times.” A method called once, whose body runs a loop over 200,000 messages, can stay under the 30-call threshold indefinitely while doing more work per second than most methods do in their entire lifetime.
That is exactly the shape of a FIX decoder’s inner loop, and it is why loop-containing methods need a promotion route that does not depend on being called again.
Why loops are special: On-Stack Replacement
On-Stack Replacement, OSR, exists to close the gap the call counter leaves open, and it works on the loop itself rather than the method. The runtime inserts patchpoints at loop back edges, the point in the compiled code where a loop returns to its top for another iteration. Each patchpoint carries its own counter, held on the invocation’s own stack frame and separate from the method-level call counter. Once a patchpoint accumulates enough hits, the default threshold is OSR_HitLimit = 10, the runtime requests an optimized version of the method on a background thread and transfers control to it mid-execution, without waiting for the method to return and be called again. Each patchpoint moves through a small state machine as this proceeds, from Unknown to Active to Pending to Ready. The design documentation states the boundary plainly: “methods that do not contain any loops will not have any patchpoints,” because there is nothing for OSR to replace mid-flight without a loop iterating inside it.
Because that counter lives on the stack frame, it resets when the invocation returns. A method called constantly but looping only briefly per call may never cross the threshold within any single invocation. A method called once whose loop runs 200,000 iterations crosses it almost immediately. The FIX decoder is the second shape, which is worth holding onto, because it constrains which explanations for the measurement are available.
Watching the run get faster mid-flight
The per-launch data lets you watch something happen inside a single process. Each launch records 15 timed series, and in 5 of the 11 stock-default launches, throughput improved by more than 8 percent between two adjacent series, with the improvement clustered at series index 10 to 14 out of 15, meaning it showed up late in the run rather than early. In 3 of those 5 launches, the drop between adjacent series was 19 to 27 percent, a single-step change large enough to see without any statistics. One launch’s final series reached 142.23 ns per message, a number that sits inside the flag-off band of 119.76 to 146.71.
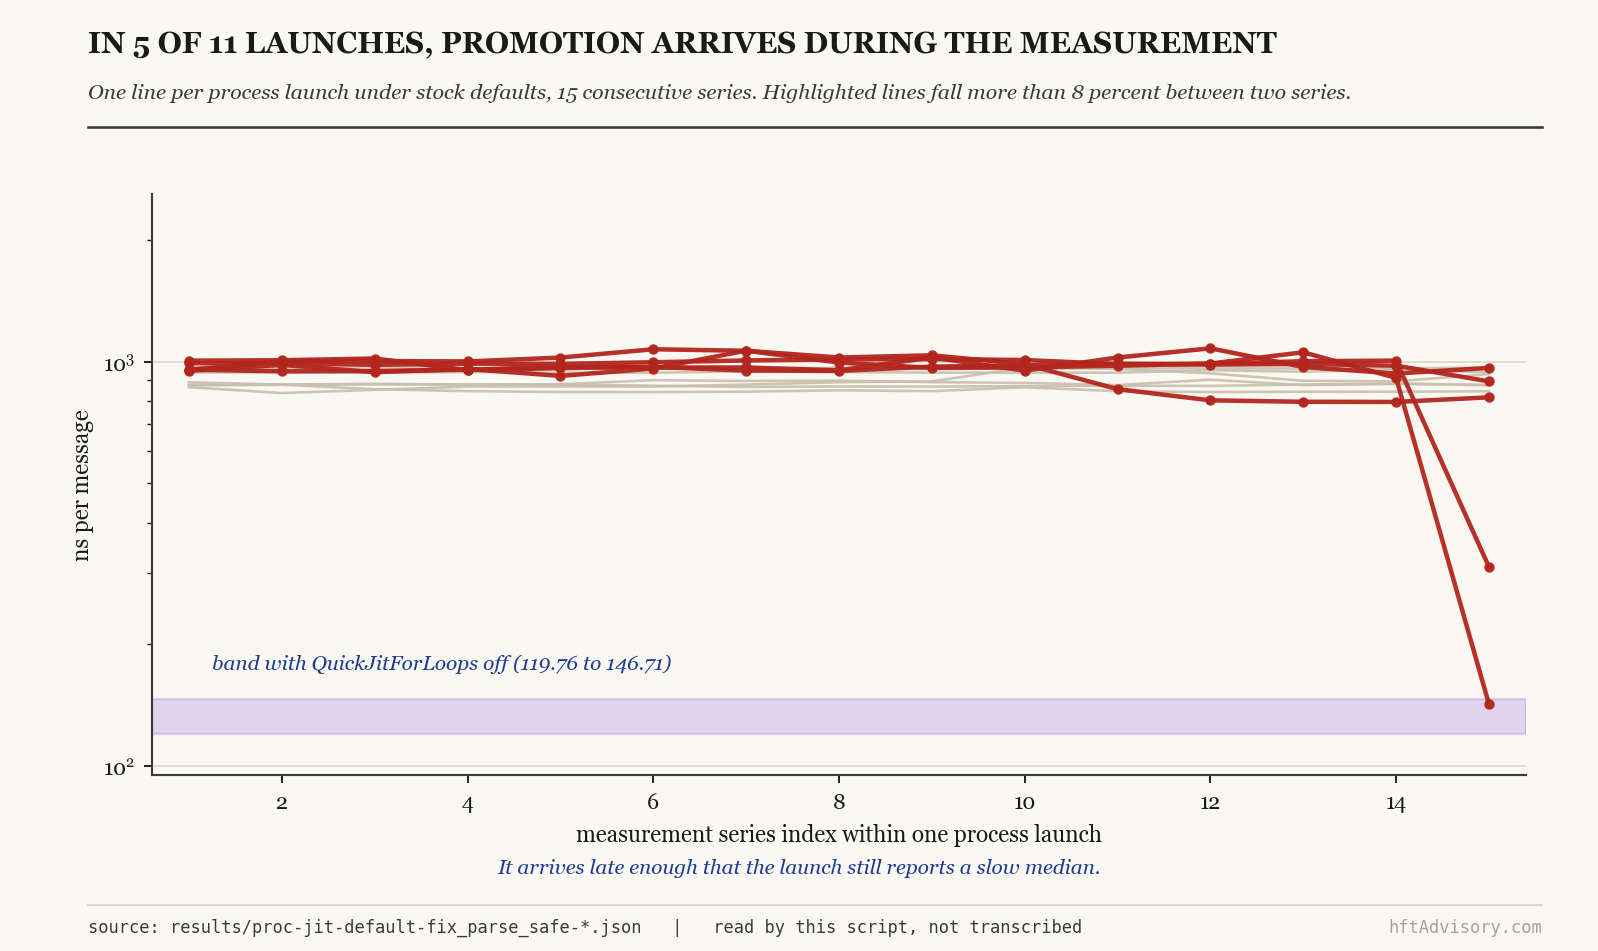
Something is arriving late, and when it arrives it is worth several hundred nanoseconds per message. I want to be careful about naming what, because the data supports more than one reading and I cannot separate them with what I have.
The first reading is that OSR promotion is late. The loop runs, the patchpoint counter crosses its threshold, the background compile is requested, and the optimized code is installed part way through the run.
The second reading is that OSR fired early, exactly as designed, and the code it produced is simply slower than tier-1 code. On that reading the late improvement is the method-level call counter finally promoting to full tier-1, arriving behind OSR rather than instead of it. This is not a hypothetical alternative I invented for balance. It is the mechanism the .NET team itself identified when this class of regression was first reported in 2023, and the relevant question then was OSR codegen quality rather than OSR timing.
Distinguishing the two requires JIT tiering events from a dotnet-trace capture or a DOTNET_JitStdOutFile dump, showing when each version was installed relative to the measurement window. That capture does not exist in this repo, so the honest position is that the measurement establishes the size and the intermittency of the penalty, and does not establish which of these two paths produced it.
One precision point matters here regardless of which reading is correct. The two-cluster, nothing-in-between description above holds at the level of per-launch medians. It does not hold for every individual sample, because that one launch’s tail did cross into the fast band before the run ended.
The documented default
Microsoft’s own runtime configuration documentation, at the time of writing last updated 2025-11-22, states this about the setting: “If you omit this setting, quick JIT is not used for methods that contain loops. This is equivalent to setting the value to false.” Taken at face value, that sentence means the safer, slower-but-more-optimized path is what you get by doing nothing. Every reader of that page who has not measured their own process has reason to believe loop-containing hot paths are protected by default.
The compiled default
The runtime source says otherwise, and the chain is short enough to walk in full. src/coreclr/inc/clrconfigvalues.h, lines 487 to 491 as of commit 72104d3, defines the internal flag UNSUPPORTED_TC_QuickJitForLoops with a default of 1 whenever FEATURE_ON_STACK_REPLACEMENT is defined, and 0 otherwise. switches.h, lines 48 to 51, defines FEATURE_ON_STACK_REPLACEMENT whenever FEATURE_TIERED_COMPILATION is defined. clrfeatures.cmake, lines 10 to 12, sets FEATURE_TIERED_COMPILATION to 1 for any standard JIT build. Follow that chain to its end and the default for any ordinary tiered-compilation build of the .NET runtime is 1, meaning quick JIT for loops is on by default. eeconfig.cpp confirms this is the live configuration path the runtime actually reads at startup, not a dead flag left over from an earlier design.
The documented default and the compiled default point in opposite directions. My measurement matches the compiled default. It does not match the documentation.
<PropertyGroup>
  <TieredCompilationQuickJitForLoops>false</TieredCompilationQuickJitForLoops>
</PropertyGroup>
Nobody has filed this
Before writing this up, I searched dotnet/docs and dotnet/runtime for an existing issue reporting the specific mismatch between that documentation page and the compiled default. Zero results. That does not mean no one has ever noticed. It means no one has filed it as a documentation bug, so it stays live and unresolved for the next engineer who reads that page and trusts it.
A closed issue asking for exactly this data
A related issue already exists, and it deserves to be described carefully. Issue #80210, “QuickJitForLoops causing regressions,” was opened 2023-01-04 by a contributor reporting a 1.95x slowdown on .NET 7, Windows x64, using a BenchmarkDotNet harness called FractalPerf.Launch.Test. Microsoft JIT team member Andy Ayers closed it on 2026-06-05 as resolved, after testing it himself.
His evidence was gathered on an Apple M4 Max running macOS 15.7.7 arm64, across .NET 8.0.27, 9.0.15, 10.0.3, and 11.0 preview 5, and it showed ratios of 0.98 to 1.06 across all four versions. The gap the original issue reported was gone on that hardware. Rather than closing the issue as simply stale, he wrote a specific, honest closing comment: “I tested on macOS arm64, not Windows x64 (where the original numbers were taken). OSR codegen quality and the QJFL impact may differ on x64. If the gap is still visible on a current Windows x64 machine with .NET 11, please reopen with fresh numbers.” That is a maintainer naming his own platform’s limitation and leaving the door open rather than declaring the question settled.
This article is an answer to that invitation, with two honest qualifications attached. He asked for .NET 11. I have .NET 10.0.10. His own closing table already includes .NET 10.0.3 at a ratio of 0.98 on macOS arm64, so the version gap between what he asked for and what I am reporting is one point release, on the opposite platform, producing the opposite result. And this is not the harness from #80210. That issue ran under BenchmarkDotNet; mine is a custom FIX decoder harness built for an unrelated language comparison. Same failure class, on Windows x64, gathered independently and without foreknowledge of the issue. It is not a reproduction of his numbers. It is a second, differently-built measurement landing on the platform he named as unverified.
One more data point worth noting in passing: the BenchmarkDotNet project itself merged a pull request, #3201, “Disable OSR by default,” on 2026-07-26. A benchmarking tool’s own maintainers choosing to disable OSR as a default is a second, independent signal that the tiering-and-OSR interaction is being treated as a real measurement hazard, separate from anything in this article.
Which hot paths are actually exposed
All four workloads measured against this flag contain loops, so “does it loop” is not the variable that predicts the penalty.
| Workload | Stock default (ns) | Flag off (ns) | Ratio |
|---|---|---|---|
fix_parse_safe |
964.13 | 124.85 | 7.72x |
fix_parse_safe_simd |
617.80 | 90.38 | 6.84x |
orderbook_l2_opt2 |
7.62 | 6.94 | 1.10x |
orderbook_l2_safe |
7.69 | 7.71 | not distinguished |
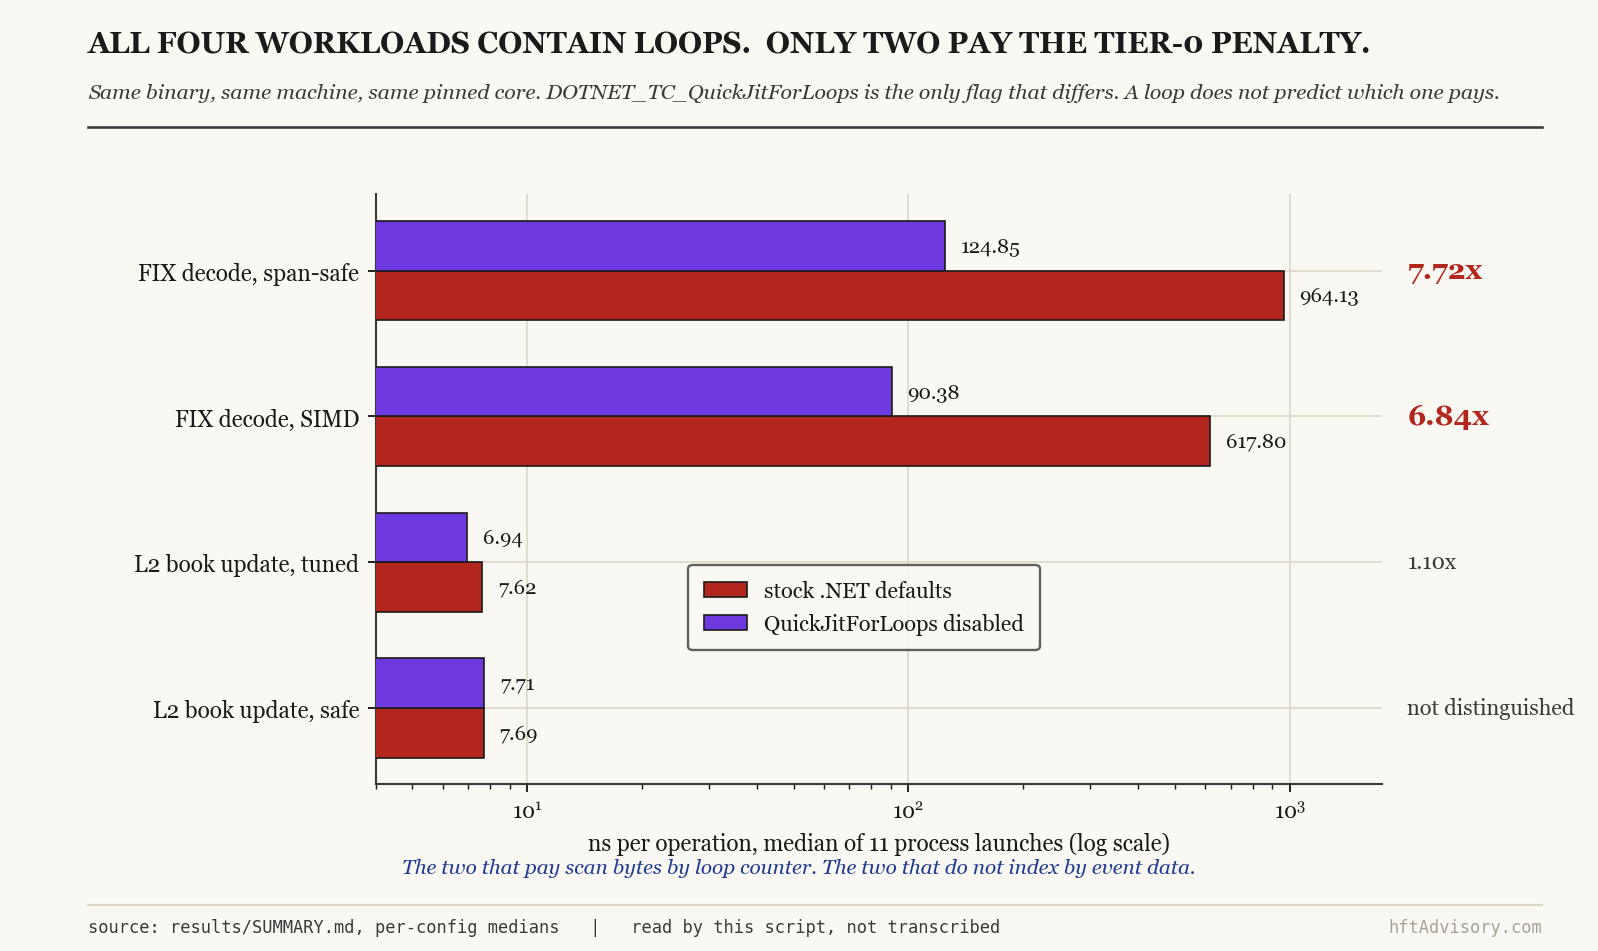
The FIX paths scan bytes with loop-counter-bounded indexing, the pattern for i in 0..s.Length: s[i] repeated inside ParseLong, ParsePrice6, FoldBytes, and the tag scanner. That shape is a textbook target for bounds-check elimination, the optimization that removes a per-element array bounds check once the compiler can prove the loop index stays inside the array. Tier-1 removes those checks. Tier-0 does not. The order book paths index into bid[idx] where idx is derived from event data rather than a loop counter, which means bounds-check elimination has nothing to grab onto at any tier, and tier-1 has correspondingly less to add over tier-0.
Read as a rule of thumb for your own code, and carrying the same uncertainty as the paragraph above, that points at a shape rather than a language feature. A hot path is more likely to be exposed when it walks a buffer with a loop counter and indexes into it by that counter, which is what parsers, decoders, checksum folds, and serializers mostly do. It is less likely to be exposed when its array indices arrive from the data rather than from the loop, which is what book updates, hash lookups, and dispatch tables mostly do. That is a place to start looking, not a verdict on your service.
I want to be precise about what that last paragraph is and is not. It is a mechanism read off the source structure of the four workloads. It is not confirmed against the generated machine code for these specific methods, because no disassembly of them exists in the repo. The measurement is consistent with the mechanism. It has not been verified against it directly.
One explanation is worth naming so it can be dismissed rather than left as an open question in a reader’s head: this is not a generics-dispatch artifact. Both the FIX and order-book paths use the identical generic mechanism, a static abstract interface member specialized over a struct (ScalarSum, NullTrace), which the runtime resolves to an exact, non-shared instantiation with no dictionary lookup involved. The order-book path uses that same ITrace mechanism and pays nothing for the flag. If generics dispatch were the cost, both families would show it. Only one does.
There is a gap in the analysis worth stating plainly rather than leaving for a reader to find on their own. The repo carries a permutation-test apparatus with Holm correction, built for its C++-versus-C# comparisons. I have not run that apparatus on the jit-default-versus-jit-qjfl comparison itself. For fix_parse_safe, the two 11-launch ranges do not overlap at all: 845.85 to 1002.21 against 119.76 to 146.71. No p-value is required to see that separation. For orderbook_l2_safe, the ranges overlap heavily, which is exactly why the table above says “not distinguished” instead of claiming no effect exists. The repo’s own equivalence documentation states the rule I am applying here: a large p-value means the comparison could not distinguish the two conditions. It does not mean the two conditions are the same.
What you give up by turning it off
Tiered compilation exists because compiling every method straight to full optimization is expensive, and most methods in a typical process are called once or a handful of times, where the optimization cost is never earned back. The only public number Microsoft has published for the general tiering time-saving is old and not specific to this flag: a 2018 devblogs post on the .NET Core 2.1 preview stated, “In our testing time spent jitting would often decrease by about 35%.” That figure describes tiered compilation broadly, years before OSR existed, not the cost of disabling quick JIT specifically for loop-containing methods. Treat it as historical context, not as a number that applies here.
Disabling TieredCompilationQuickJitForLoops means every loop-containing method compiles straight to tier-1 on its first call, which costs more JIT time at startup than the tiered default would. Microsoft publishes no figure for that cost, so the useful move is to solve for it. The penalty is 839.28 ns per message and the JIT cost is paid once per process, so the flag only loses if first-call compilation of those methods costs more than the penalty accumulated between restarts. A gateway taking 500,000 messages per second and restarting every fifteen minutes accumulates about 378 seconds of extra decode CPU per interval. At 50,000 messages per second restarting every five minutes it is still about 13 seconds. Microsoft does not publish that startup cost and I have not measured it, so I will not put a number on it. What the arithmetic does fix is the bar it would have to clear: on those two cadences, first-call compilation of the loop-containing methods would need to cost somewhere between 13 and 378 seconds before leaving the default in place becomes the better trade. If your own restart cadence is fast enough that the bar looks reachable, that is the number worth measuring before you decide. For a process that starts, runs for days, and serves a hot path the whole time, that one-time startup cost is small against the alternative, which is running 7.72x slower on the hot path for the entire lifetime of the process. For a process that starts and exits quickly, a serverless function, a short-lived CLI invocation, a container that scales to zero between requests, the calculation can flip, because the extra startup JIT time is now the majority of the process’s total runtime and there may be no long steady state left to amortize it against.
What to do on Monday
Set the flag in the csproj, or set the equivalent environment variable, DOTNET_TC_QuickJitForLoops=0, if you need it configurable at deploy time rather than compile time. Before doing either blindly, measure your own process the way this article’s numbers were gathered, because the point of this piece is the method, not the flag.
Start your actual hot-path service 20 times from a cold process launch, the same binary, the same configuration, no warm pool. For each start, measure throughput or latency on the hot path over its first several thousand operations, separately from any steady-state number you already track. Look at the distribution of those 20 launches, not the average. An aggregate number hides exactly the split this article is built on: two clusters with nothing between them do not show up in a mean, only in the individual launches. If your distribution is bimodal, you have the same exposure measured here. If it is not, the flag may cost you more at startup than it saves you at runtime, and the right answer for your process is not the same as the right answer for a benchmark hammered from message one.
What is still open
Three questions from this measurement stay open, and I have not closed any of them.
I do not know whether the late improvement inside a run is OSR arriving or tier-1 arriving behind OSR. Separating those needs a JIT tiering trace this repo does not contain.
I do not know whether a hot method with no loop at all, one that gets called often enough to cross the 30-call threshold on its own, carries any of this same exposure through a different path, or whether the call-counter route to promotion is reliably faster in practice than the OSR route measured here.
I also do not know whether a container’s cold start, where the process may have even less time before its next restart than a bare-metal launch, compounds the problem by shrinking the window available before the container cycles again.
The 20-cold-start protocol above is the test that would answer the second and third, on your own workload rather than mine. If you run it and your numbers disagree with mine, on .NET 11, on Linux, in a container, or on a workload shaped differently from either of these, that measurement is the one I want to see. If you run it and get a clean unimodal distribution, or a bimodal one worse than this one, that result is the one worth having on record, because right now the only Windows x64 data point on this specific interaction is the one in this article.
Originally shared as a LinkedIn post: linkedin.com/feed/update/urn:li:activity:7498814180674736128.
Ariel Silahian designs and audits electronic trading systems architecture. hftAdvisory.com.
The full harness, raw per-launch result files, and figure generation scripts behind this article are public: github.com/silahian/hft-dotnet-vs-cpp.
Never Miss an Update
Get notified when we publish new analysis on HFT, market microstructure, and electronic trading infrastructure. No spam.
Subscribe by EmailAriel Silahian is a senior technology executive in institutional electronic trading, with 30+ years across the buy and sell side (New York, Miami, London, Hong Kong). He is the author of "C++ High Performance for Financial Systems" (Packt) and the creator of VisualHFT, the open-source microstructure analytics stack. He writes on exchange architecture, market microstructure, and execution quality, and advises a select number of trading firms on infrastructure decisions that move P&L. Book a strategy call at hftAdvisory.com